How Much Energy Does a 10 MW Solar Plant Produce? Real Data from Spain
A 10 MW photovoltaic plant is one of the most common project sizes in Spain — large enough to warrant a grid connection study and an environmental impact assessment, but small enough to be developed by independent project developers and regional energy companies. Yet when people ask how much energy a 10 MW plant actually produces, the answers they find are often generic, based on global averages that bear little relation to conditions in Spain.
This article gives you real production data for 10 MW photovoltaic plants in Spain, broken down by region, technology type and system configuration. The numbers come from actual plants tracked by PV Maps, not from theoretical calculations alone.
The Short Answer: 16,000 to 22,000 MWh per Year
A 10 MWp photovoltaic plant in Spain generates between 16,000 and 22,000 MWh of electricity per year, depending primarily on:
- Geographic location (irradiance levels vary significantly across Spain)
- Panel mounting system (fixed tilt vs. single-axis tracker)
- Panel technology (standard monofacial vs. bifacial modules)
- System losses (soiling, shading, inverter efficiency, cable losses, degradation)
To put these numbers in context: 20,000 MWh per year is enough electricity to supply approximately 5,500 average Spanish households, or to avoid around 7,500 tonnes of CO2 emissions annually (using Spain’s average grid emissions factor).
The Key Variable: Where in Spain Is the Plant?
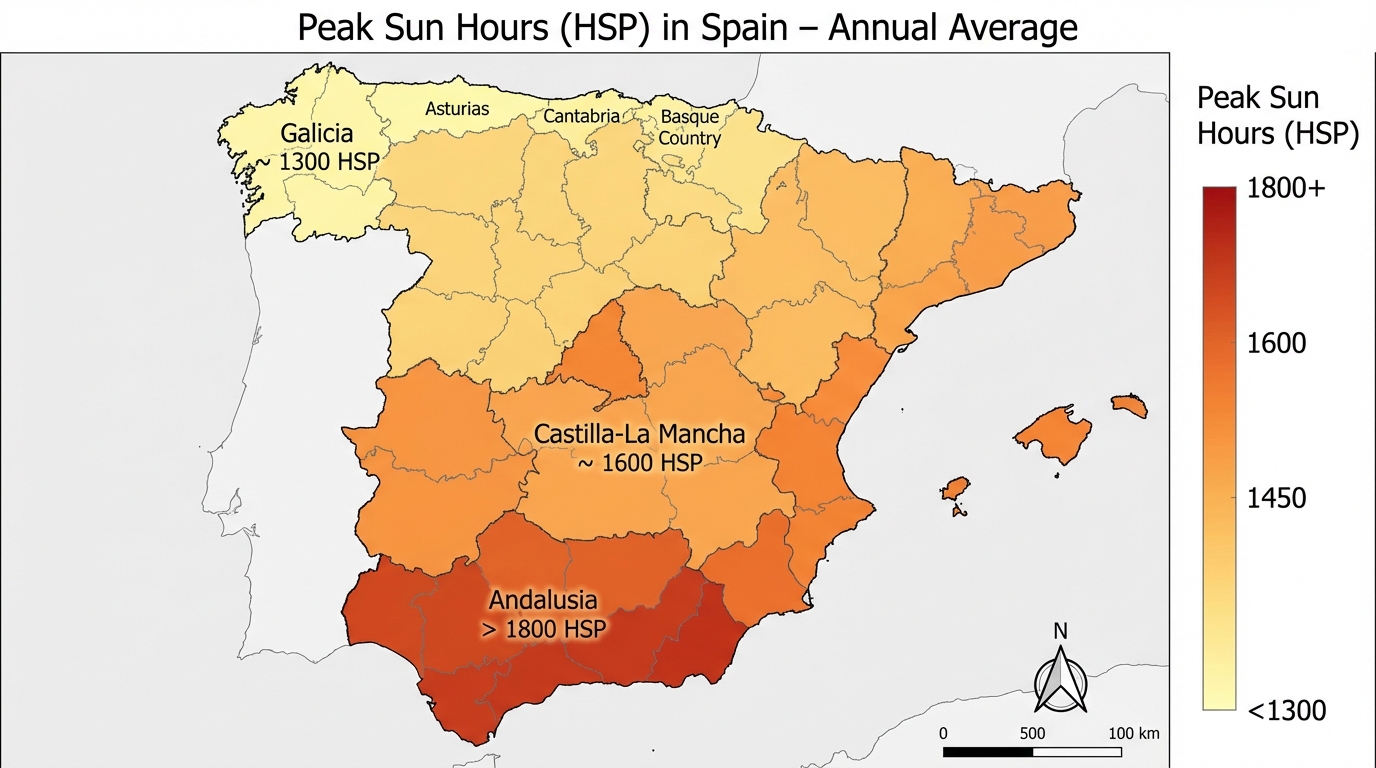
Spain has one of the most varied solar resource profiles in Europe. The difference between the sunniest province (Almería or Huelva, ~1,900-2,100 kWh/m²/year of global horizontal irradiance) and the least sunny (inland Galicia or the Basque Country, ~1,100-1,300 kWh/m²/year) is enormous.
Annual Production by Region for a 10 MWp Plant (Fixed Tilt, Monofacial)
| Region | GHI (kWh/m²/year) | Estimated Annual Production |
|---|---|---|
| Andalusia (Huelva, Almería) | 1,900 - 2,100 | 19,000 - 21,000 MWh |
| Extremadura (Cáceres, Badajoz) | 1,850 - 2,050 | 18,500 - 20,500 MWh |
| Murcia / Valencia coast | 1,800 - 2,000 | 18,000 - 20,000 MWh |
| Castilla-La Mancha | 1,750 - 1,950 | 17,500 - 19,500 MWh |
| Castilla y León | 1,600 - 1,800 | 16,000 - 18,000 MWh |
| Aragon | 1,700 - 1,900 | 17,000 - 19,000 MWh |
| Catalonia (inland) | 1,650 - 1,850 | 16,500 - 18,500 MWh |
| Galicia / Cantabria | 1,100 - 1,400 | 11,000 - 14,000 MWh |
These figures assume a typical performance ratio (PR) of 80-82%, which accounts for real-world losses in a well-maintained plant.
For detailed irradiance data by province, see the solar irradiance map of Spain.
How Tracking Technology Changes Everything
![]()
The most impactful design decision for a 10 MW plant — after choosing the location — is whether to use fixed-tilt mounting or single-axis trackers.
Fixed-Tilt Systems
Panels are mounted at a fixed angle (typically 25-35 degrees from horizontal, facing south). Simple, lower maintenance cost, and well-suited to sites with uneven terrain where tracker installation is impractical.
Typical specific yield (Extremadura): 1,700-1,850 kWh/kWp/year
Single-Axis Trackers
Panels rotate east-to-west throughout the day, following the sun’s movement. This significantly increases morning and afternoon generation — exactly the hours when wholesale electricity prices tend to be higher than at solar noon.
Typical specific yield (Extremadura): 2,000-2,200 kWh/kWp/year
Production gain vs. fixed tilt: 15-25% more annual energy
The tracker premium is roughly €40,000-70,000/MWp in additional capex. Given that the extra energy generated is sold at market price, the payback on the tracker upgrade is typically 4-7 years for southern Spain locations. The vast majority of utility-scale plants built in Spain since 2019 use single-axis trackers.
Bifacial Panels: The Additional Gain
Modern bifacial photovoltaic modules capture sunlight on both the front and rear faces of the panel. The rear face generates additional energy from reflected light (albedo) off the ground surface beneath the panel.
In Spain, bifacial gain typically adds 3-8% to annual production compared to equivalent monofacial modules, depending on:
- Ground albedo (lighter-coloured soil or gravel increases rear-face irradiance)
- Mounting height and row spacing (higher mounting allows more reflected light to reach the rear)
- Tracker vs. fixed tilt (trackers generally show higher bifacial gain due to geometry)
Combined Effect: Tracker + Bifacial in Extremadura
A 10 MWp plant in Extremadura with single-axis trackers and bifacial modules can realistically achieve:
- Specific yield: 2,100 - 2,400 kWh/kWp/year
- Annual production: 21,000 - 24,000 MWh
This is the configuration used by the largest and most modern utility-scale plants in Spain, and it is now the de facto standard for new projects above 5 MWp.
Real Production Data: What Actual Plants Show
Looking at actual production records from 10-15 MWp plants tracked by PV Maps across Spain:
Andalusia — 12 MWp plant (Huelva province, single-axis tracker, bifacial)
- 2023 actual production: 26,400 MWh (2,200 kWh/kWp)
- 2024 actual production: 25,800 MWh (2,150 kWh/kWp)
- Note: 2024 slightly below 2023 due to above-average cloudy periods in Q1
Castilla-La Mancha — 10 MWp plant (Ciudad Real, fixed tilt, monofacial)
- 2023 actual production: 17,900 MWh (1,790 kWh/kWp)
- 2024 actual production: 18,200 MWh (1,820 kWh/kWp)
Extremadura — 15 MWp plant (Badajoz, single-axis tracker, bifacial)
- 2023 actual production: 33,600 MWh (2,240 kWh/kWp)
- 2024 actual production: 32,400 MWh (2,160 kWh/kWp)
These figures demonstrate that even within the same technology category, year-to-year variation of 3-5% is normal due to irradiance variability.
Key Losses That Reduce Real Production
The gap between theoretical maximum output and actual production comes from a range of technical and operational factors. For a 10 MWp plant, the main loss categories are:
| Loss Category | Typical Range |
|---|---|
| Soiling (dust, bird droppings) | 1 - 5% |
| Module mismatch and shading | 0.5 - 2% |
| Inverter efficiency losses | 1 - 3% |
| Cable and transformer losses | 0.5 - 1.5% |
| Module temperature losses | 3 - 6% (high in southern Spain) |
| Annual degradation (year 1) | 0.5 - 1% |
| Curtailment (grid instruction) | 0 - 4% (region-dependent) |
Total system losses of 15-22% relative to ideal conditions are typical, resulting in the 80-82% performance ratio mentioned earlier.
Converting Production to Revenue
Knowing how much energy a 10 MW plant produces is the first step. The second is converting that to revenue.
At a market price of €45/MWh (a reasonable mid-range assumption for Spain in 2026):
- 18,000 MWh/year x €45/MWh = €810,000/year
- 21,000 MWh/year x €45/MWh = €945,000/year
Given typical O&M costs of €80,000-120,000/year for a 10 MWp plant, and assuming no debt service (unlevered), EBITDA margins of 85-90% are achievable.
Use the irradiance converter calculator to estimate production for your specific location and configuration.
Frequently Asked Questions
How many homes can a 10 MW solar plant power?
Based on Spanish residential consumption averages (~3,500 kWh/household/year), a 10 MWp plant producing 19,000 MWh annually can supply approximately 5,400 households.
Does a 10 MW plant need a grid connection study?
Yes. In Spain, any plant above 100 kW requires a formal grid access and connection study (Estudio de Acceso y Estudio de Conexión) submitted to REE (national grid) or the regional distributor, depending on the voltage level of the connection point.
What is the land area needed for a 10 MW solar plant in Spain?
Typical land requirements are 15 to 25 hectares for a 10 MWp plant, depending on the mounting system (trackers require more space between rows) and the terrain. The standard ground coverage ratio (GCR) for utility-scale plants in Spain ranges from 25% to 40%.
Explore Real Production Data for Spanish Solar Plants
The best way to understand what a 10 MW plant actually produces in any given Spanish province is to look at real plants that are already operating there.
Explore solar irradiance data by province to see the resource available in your target location.
Use the irradiance converter to estimate production for your specific configuration, tilt angle and technology choice.
Or view all data to access the full production and revenue database for operational photovoltaic plants across Spain.