How to Calculate the LCOE of a Solar Plant: Formula and Practical Example
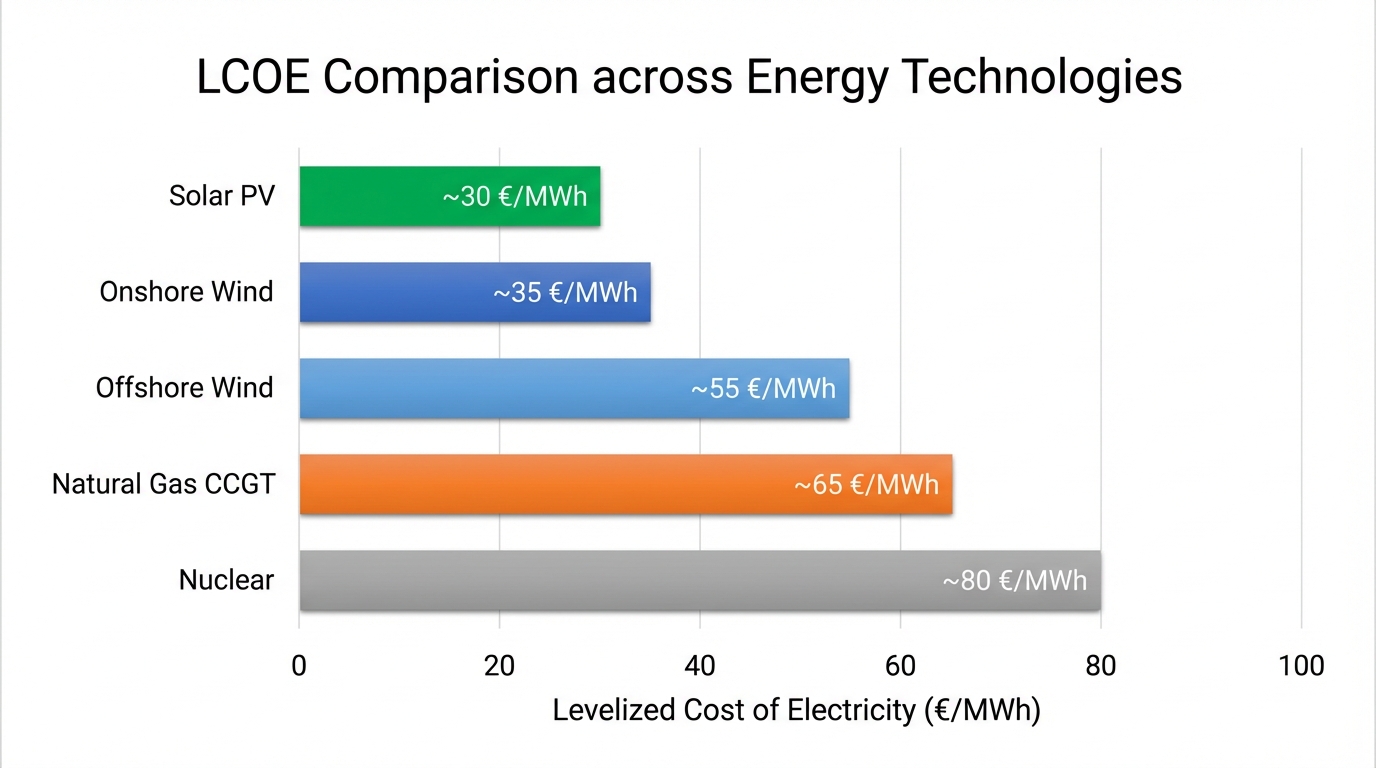
LCOE — the Levelized Cost of Energy — is the single most important metric in energy economics. It is the yardstick by which solar competes with gas, wind, coal and nuclear. It is the number that determines whether your project gets financed or abandoned. And yet, despite its importance, it is widely misunderstood and frequently miscalculated.
This article explains how to calculate the LCOE of a photovoltaic solar plant, step by step, with the actual formula, a clear explanation of every input variable, and a worked example using real data from a utility-scale plant in Spain.
What LCOE Actually Measures
LCOE answers a deceptively simple question: What is the minimum price at which we must sell each unit of electricity produced by this plant, over its entire lifetime, to recover all costs?
If LCOE is €35/MWh and the current wholesale electricity price is €50/MWh, the project is profitable. If LCOE is €65/MWh and the market pays €45/MWh, the project destroys value.
LCOE is expressed in euros per megawatt-hour (€/MWh) and allows comparison across different technologies, project sizes and countries on a like-for-like basis.
The LCOE Formula
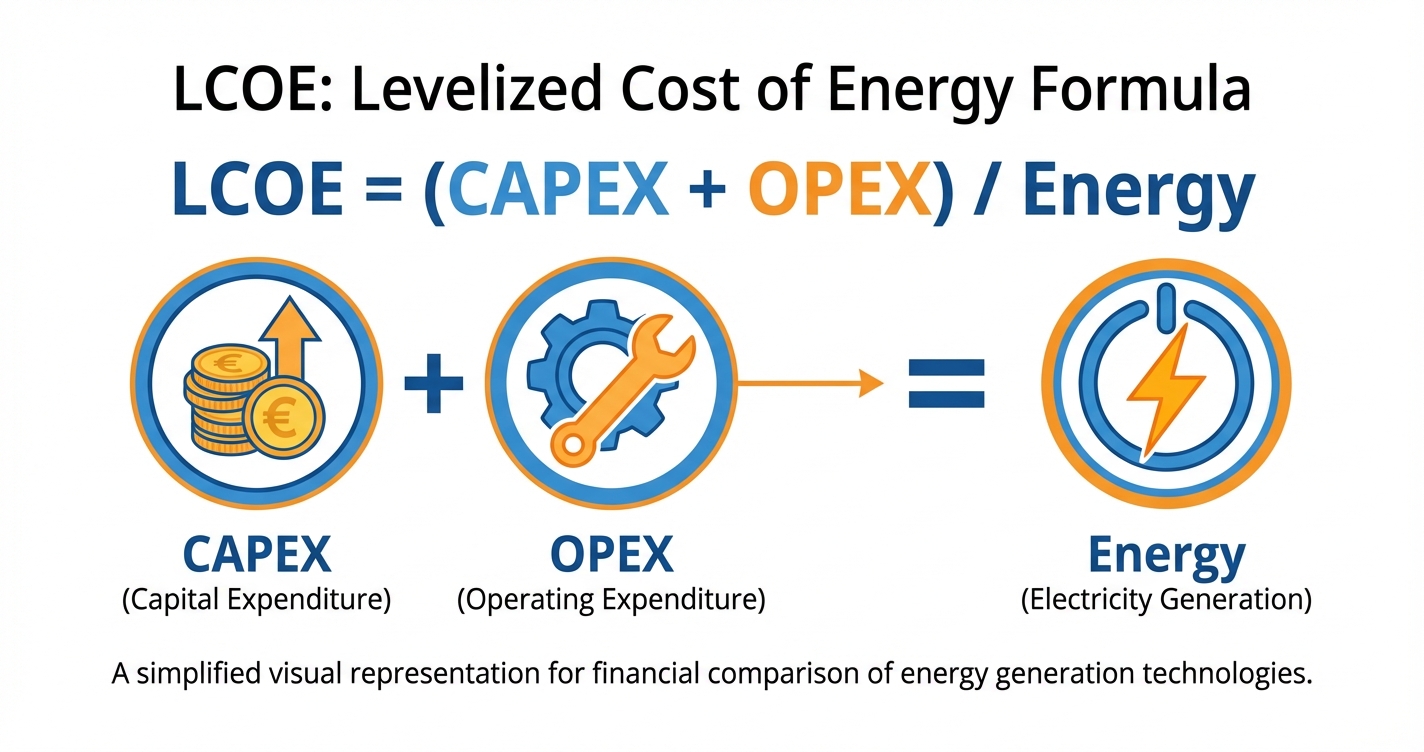
The standard LCOE formula is:
LCOE = Total Lifetime Costs (NPV) / Total Lifetime Energy Production (NPV)
More formally:
LCOE = [ I₀ + Σ(Cₜ / (1 + r)ᵗ) ] / Σ(Eₜ / (1 + r)ᵗ)Where:
- I₀ = Initial capital expenditure (capex) at year 0 (EUR)
- Cₜ = Annual operating costs in year t (EUR/year)
- Eₜ = Annual energy production in year t (MWh/year)
- r = Discount rate (decimal, e.g. 0.07 for 7%)
- t = Year (from 1 to N, typically N = 25 or 30 years)
The summation (Σ) runs from year 1 to the end of the plant’s useful life (N). Both costs and energy production are discounted to present value using the discount rate r.
Breaking Down Each Input Variable
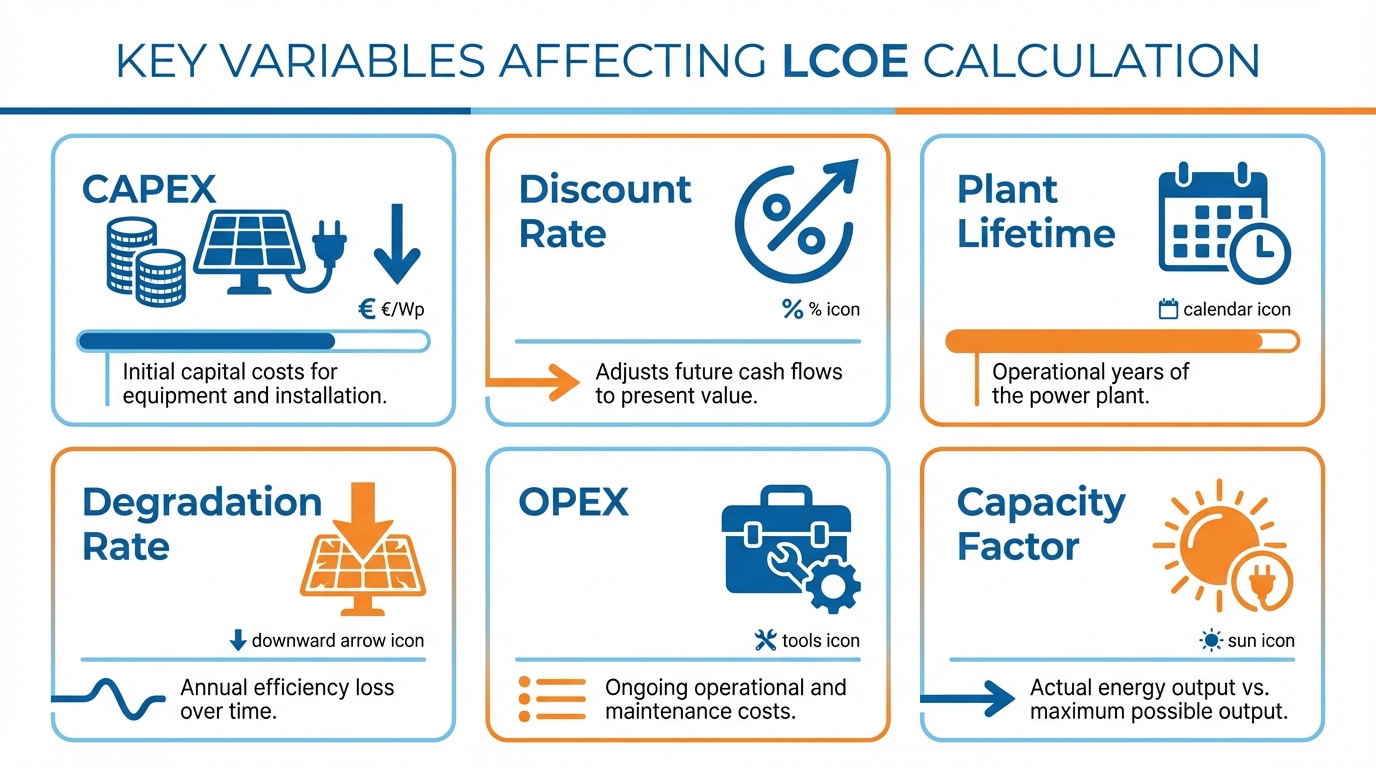
1. Initial Capital Expenditure (CAPEX)
CAPEX includes everything required to get the plant to commercial operation:
- PV modules: The largest single cost item. Utility-scale bifacial modules in Spain in 2026 cost approximately €0.12-0.18/Wp (module only).
- Inverters: Typically 5-10% of total equipment cost.
- Mounting structures / trackers: Single-axis trackers add €60,000-90,000/MWp versus fixed-tilt.
- Civil works and cabling: Trenching, cabling, fencing, access roads.
- Substation and grid connection: Can be €0 to €100,000+/MWp depending on distance to grid and connection voltage.
- Engineering, procurement and construction (EPC) margin: 5-12% on top of equipment and civil costs.
- Development costs: Permits, environmental studies, technical studies. Typically €20,000-50,000/MWp for a mature project.
- Finance costs during construction: Interest during construction (IDC).
Typical total CAPEX for utility-scale PV in Spain (2026): €550,000 - €750,000 per MWp installed, depending on location, grid distance and technology choices.
2. Annual Operating Costs (OPEX)
OPEX includes all costs incurred during the operational life of the plant:
- O&M contract: Preventive and corrective maintenance, monitoring, spare parts. Typically €8,000-14,000/MWp/year for utility-scale plants in Spain.
- Land lease: Ranges from €500 to €2,500/ha/year depending on region and land quality. For a 20-25 ha/MWp density plant, this is €10,000-60,000/MWp/year.
- Insurance: Property and liability insurance, approximately €3,000-6,000/MWp/year.
- Grid access fees: REE access tariff (peaje de acceso), typically €2,000-4,000/MWp/year.
- Asset management and administration: Legal, accounting, regulatory compliance, typically €1,000-3,000/MWp/year.
- Major component replacements: Inverter replacements (typically at year 10-15), planned module cleaning campaigns.
Typical total OPEX for utility-scale PV in Spain: €25,000-45,000/MWp/year (all-in, excluding debt service).
3. Annual Energy Production (Eₜ)
This is the actual MWh injected into the grid each year, accounting for:
- Location-specific irradiance (GHI)
- Panel tilt and orientation
- Tracker gain (if applicable)
- Bifacial gain (if applicable)
- System losses (soiling, shading, inverter losses, cable losses, temperature)
- Annual degradation rate (typically 0.4-0.7% per year for modern modules)
For a 10 MWp plant in Extremadura with trackers and bifacial panels, year-1 production might be 22,000 MWh. By year 25, after applying 0.5%/year degradation, production falls to approximately 19,500 MWh.
4. Discount Rate (r)
The discount rate reflects the time value of money and the cost of capital. In LCOE calculations for solar projects:
- Unlevered (project) WACC: Typically 6-9% for utility-scale PV in Spain in 2026
- Equity discount rate (for equity-based LCOE): 8-12%
- Real vs. nominal: LCOE can be calculated in real terms (excluding inflation) or nominal terms. Make sure you are consistent — do not mix real costs with a nominal discount rate.
The discount rate is the most subjective input in the LCOE calculation. A 1 percentage point increase in r raises LCOE by approximately 8-12% for a typical solar project. This is why the cost of financing matters enormously for solar competitiveness.
Worked Example: 10 MWp Plant in Badajoz
Let us calculate LCOE for a real-world scenario using data representative of a utility-scale plant in Badajoz, Extremadura.
Project Inputs
| Parameter | Value |
|---|---|
| Installed capacity | 10 MWp |
| Technology | Bifacial modules, single-axis trackers |
| Location | Badajoz (Extremadura) |
| Initial CAPEX | €6,500,000 (€650,000/MWp) |
| Annual OPEX (year 1) | €320,000 (€32,000/MWp) |
| OPEX escalation | 1.5%/year |
| Year-1 production | 22,000 MWh |
| Annual degradation | 0.5%/year |
| Project lifetime | 25 years |
| Discount rate | 7% (real, nominal inflation ~2%) |
Calculation Summary
For brevity, here is the simplified calculation (full NPV calculation would run year by year):
NPV of costs:
- CAPEX (year 0): €6,500,000
- NPV of OPEX over 25 years at 7% discount rate and 1.5% escalation: approximately €3,850,000
- Total NPV of costs: ~€10,350,000
NPV of energy production:
- Year-1 production: 22,000 MWh, degrading 0.5%/year
- NPV of total production over 25 years at 7% discount rate: approximately 220,000 MWh (discounted)
LCOE = €10,350,000 / 220,000 MWh = €47/MWh
At current OMIE wholesale prices of €40-55/MWh, this project sits right at the margin of viability — profitable in good price years, breakeven in weak years. To improve the LCOE, the project would need to either reduce CAPEX (achieve better procurement), increase production (better site or technology), or reduce the discount rate (stronger financing terms).
How LCOE Varies Across Spain
The location effect on LCOE is substantial. Using the same project parameters but changing location:
| Location | Annual Production (MWh) | Estimated LCOE |
|---|---|---|
| Huelva / Almería | 23,000 - 25,000 | €42 - 46/MWh |
| Badajoz / Cáceres | 21,000 - 23,000 | €45 - 50/MWh |
| Murcia | 20,000 - 22,000 | €46 - 52/MWh |
| Castilla-La Mancha | 19,000 - 21,000 | €48 - 55/MWh |
| Aragon | 18,000 - 20,000 | €52 - 58/MWh |
| Castilla y León | 17,000 - 19,000 | €54 - 62/MWh |
These LCOE ranges explain why southern Spain dominates new utility-scale development: the irradiance advantage directly translates to lower LCOE, making projects more bankable and competitive.
Common LCOE Mistakes to Avoid
Using the Wrong Degradation Rate
Module manufacturers often quote 0.25-0.35%/year degradation. Independent studies and real operational data from utility-scale plants consistently show 0.45-0.7%/year. Using an optimistic degradation assumption can understate LCOE by 5-10%.
Ignoring End-of-Life Costs
Decommissioning and module recycling costs are real — and growing as regulators tighten requirements. The EU’s WEEE Directive and Spain’s environmental legislation are increasing decommissioning liabilities. A fully loaded LCOE should include a small provision for end-of-life costs (typically €10,000-20,000/MWp).
Comparing Real LCOE to Nominal Market Prices
If your LCOE is calculated in real (inflation-adjusted) terms, you must also express market revenue in real terms before comparing. Mixing real and nominal figures systematically understates LCOE relative to revenue.
Use the PV Maps LCOE Calculator
Rather than building your own spreadsheet model from scratch, the PV Maps LCOE calculator allows you to input your project-specific values for CAPEX, OPEX, production and discount rate, and instantly calculates LCOE with full sensitivity analysis.
You can also combine it with the revenue calculator to compare your LCOE against actual historical market prices for any province in Spain — giving you a data-backed answer to the fundamental question: is this project worth building?
Start Your LCOE Analysis Today
Open the LCOE calculator to calculate the levelized cost for your project with your own inputs.
Compare against real market revenue data to see whether your LCOE is competitive with actual prices in your target market.
Or view all data to see how PV Maps can support your full investment analysis workflow — from irradiance and production modelling to LCOE calculation and market benchmarking.