Solar Irradiance Map of Spain by Province: Complete Guide
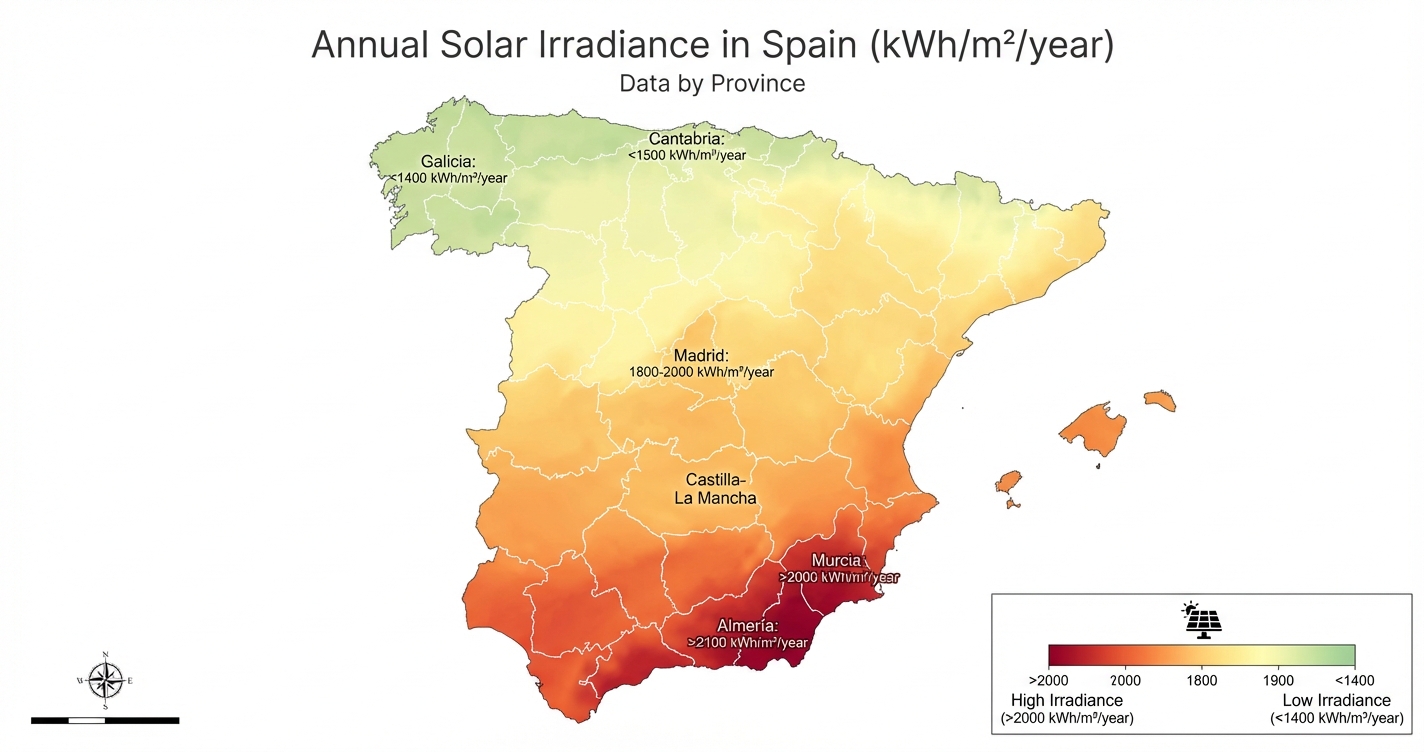
Spain is one of the most solar-rich countries in Europe — but that headline conceals enormous variation within the country itself. A photovoltaic plant in Almería receives nearly twice the solar irradiance of a plant in coastal Galicia. Getting the irradiance right is not a secondary detail in project development: it is the single variable that most determines whether a project is financially viable.
This complete guide covers solar irradiance in Spain by province, explaining the key metrics (GHI, DNI and diffuse radiation), showing province-by-province data, and explaining how to use irradiance data in real project sizing decisions.
The Three Solar Irradiance Metrics You Need to Know
Before diving into the data, it is essential to understand what the different irradiance measurements mean and which one applies to your technology.
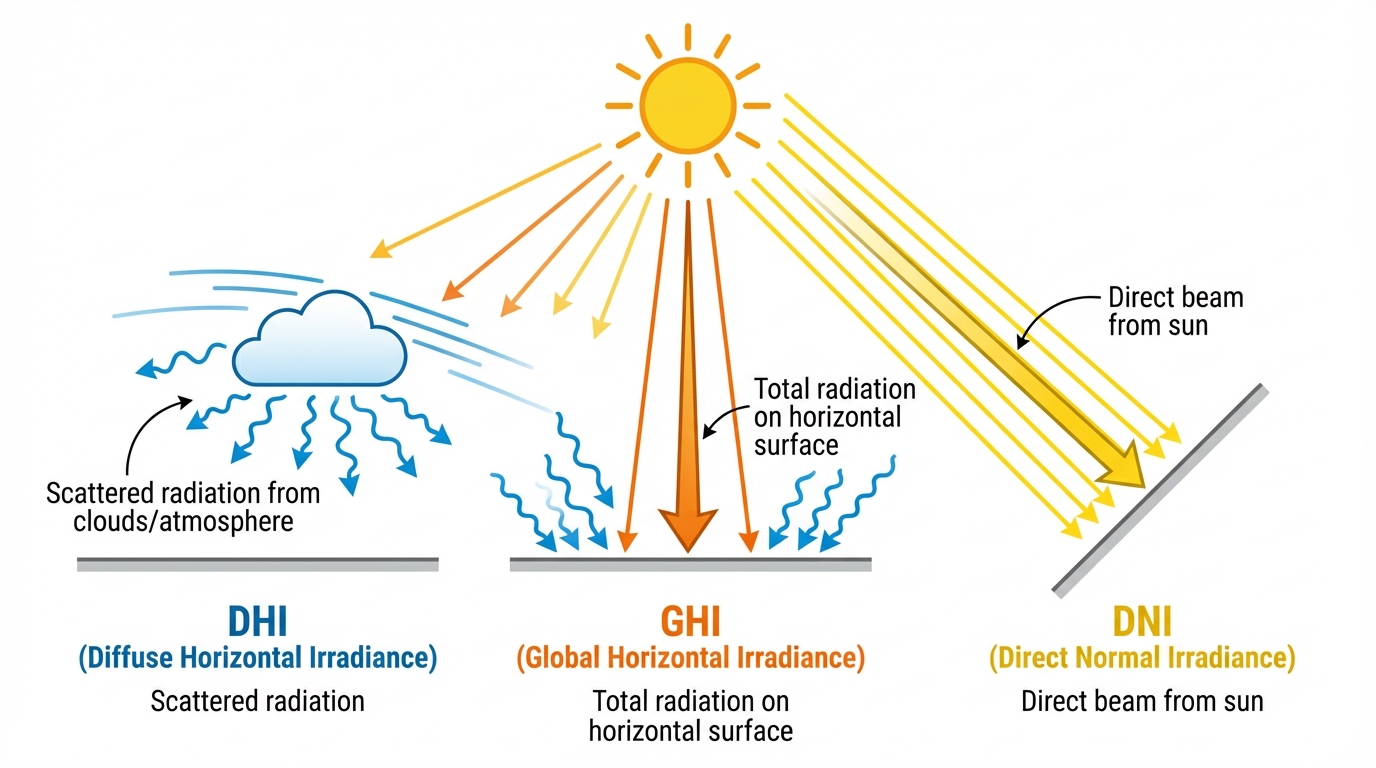
GHI — Global Horizontal Irradiance
GHI (kWh/m²/year) measures the total solar radiation received on a horizontal surface. It is the most widely cited irradiance figure and the primary metric for sizing flat-panel photovoltaic systems (including tilted fixed-rack systems, since GHI is used as the input and then corrected for tilt angle and orientation).
GHI is the number you see most often in solar resource maps and yield assessments.
DNI — Direct Normal Irradiance
DNI (kWh/m²/year) measures only the direct beam radiation received on a surface perpendicular to the sun’s rays. It is the key metric for concentrating solar power (CSP) technologies — parabolic trough, Fresnel and power tower systems — which require direct sunlight and cannot use diffuse radiation.
For standard PV projects, DNI is less directly relevant, but high DNI locations also tend to have high GHI and lower diffuse fraction, which benefits bifacial modules and can reduce soiling losses.
DHI — Diffuse Horizontal Irradiance
DHI measures only the diffuse radiation (sunlight scattered by clouds, atmosphere and terrain). In cloudy northern Spain, DHI represents a larger proportion of total irradiance than in sunny Andalusia. Standard PV panels capture diffuse light efficiently; some concentrated technologies cannot.
GHI = DNI × cos(solar zenith angle) + DHI — the fundamental relationship between the three.
Solar Irradiance by Province: The Complete Data
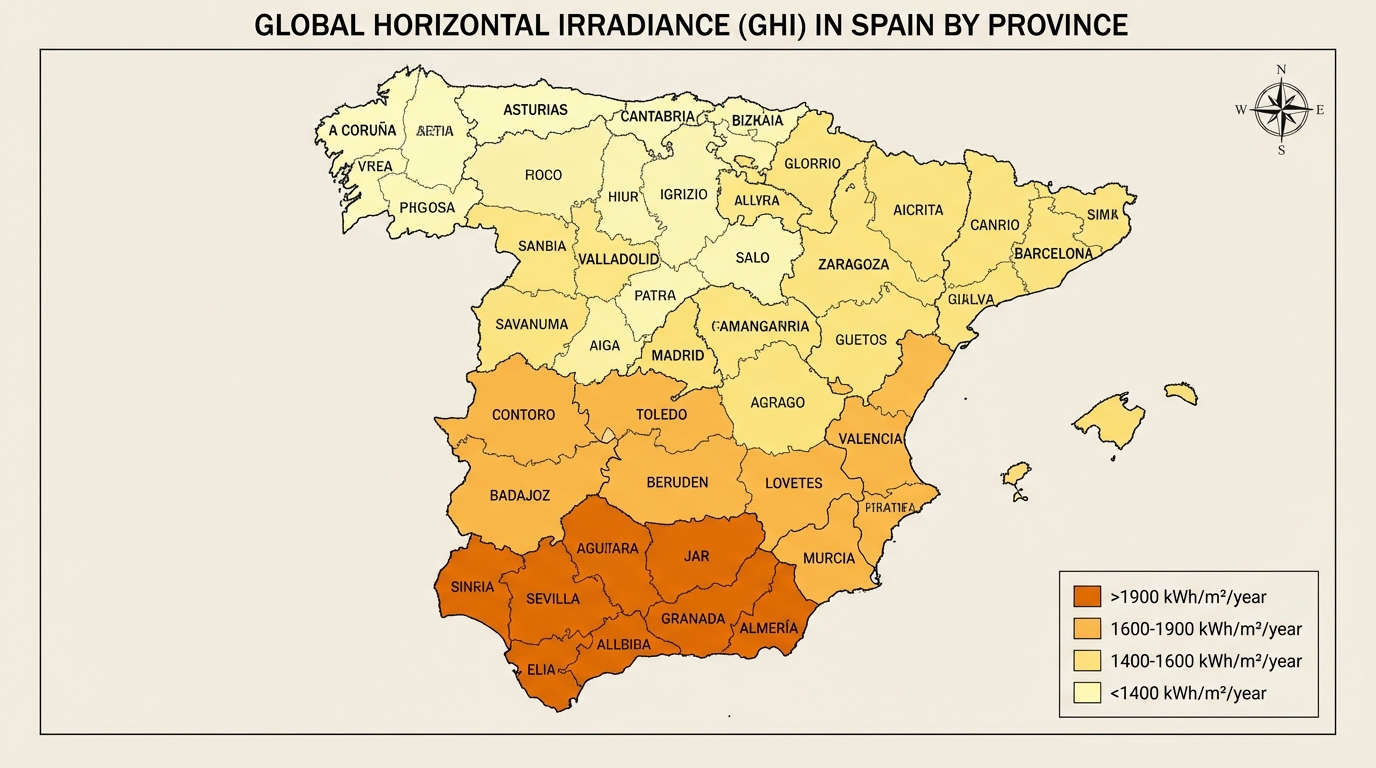
The following table presents annual GHI values by Spanish province, based on satellite-derived irradiance data (PVGIS / Solargis methodology). Values represent typical meteorological year (TMY) averages.
Andalusia — Spain’s Solar Powerhouse
| Province | GHI (kWh/m²/year) | DNI (kWh/m²/year) | Classification |
|---|---|---|---|
| Huelva | 1,920 - 2,050 | 2,100 - 2,300 | Excellent |
| Almería | 1,950 - 2,100 | 2,200 - 2,500 | Excellent |
| Sevilla | 1,880 - 2,000 | 2,000 - 2,200 | Excellent |
| Cádiz | 1,800 - 1,950 | 1,900 - 2,100 | Very good |
| Córdoba | 1,850 - 1,980 | 2,000 - 2,200 | Excellent |
| Jaén | 1,800 - 1,950 | 1,950 - 2,150 | Very good |
| Granada | 1,750 - 1,950 | 1,900 - 2,100 | Very good |
| Málaga | 1,800 - 1,950 | 1,850 - 2,100 | Very good |
Andalusia consistently records Spain’s highest irradiance values. The combination of high DNI and clear skies makes it particularly attractive for both utility-scale PV and CSP (the latter concentrated around Sevilla).
Extremadura
| Province | GHI (kWh/m²/year) | DNI (kWh/m²/year) | Classification |
|---|---|---|---|
| Badajoz | 1,850 - 2,000 | 1,950 - 2,200 | Excellent |
| Cáceres | 1,800 - 1,950 | 1,900 - 2,100 | Excellent |
Extremadura’s irradiance levels are nearly as high as Andalusia, but with the added advantage of large, flat, low-cost land parcels — which is why the region hosts the greatest concentration of utility-scale PV capacity in Spain.
Murcia and Valencia
| Province | GHI (kWh/m²/year) | DNI (kWh/m²/year) | Classification |
|---|---|---|---|
| Murcia | 1,850 - 2,000 | 1,950 - 2,200 | Excellent |
| Alicante | 1,800 - 1,950 | 1,850 - 2,050 | Very good |
| Valencia | 1,650 - 1,800 | 1,700 - 1,900 | Good |
Murcia has among Spain’s highest GHI values and hosts the 494 MWp Mula solar plant, one of the largest in the country. Coastal humidity moderates irradiance slightly compared to inland Andalusia.
Castilla-La Mancha
| Province | GHI (kWh/m²/year) | DNI (kWh/m²/year) | Classification |
|---|---|---|---|
| Ciudad Real | 1,750 - 1,900 | 1,800 - 2,000 | Very good |
| Albacete | 1,750 - 1,900 | 1,800 - 2,000 | Very good |
| Toledo | 1,700 - 1,850 | 1,750 - 1,950 | Good-Very good |
| Cuenca | 1,650 - 1,800 | 1,700 - 1,900 | Good |
| Guadalajara | 1,600 - 1,750 | 1,650 - 1,850 | Good |
The Castilla-La Mancha plateau combines solid irradiance levels with flat terrain, driving significant development activity particularly in Ciudad Real and Albacete.
Castilla y León
| Province | GHI (kWh/m²/year) | DNI (kWh/m²/year) | Classification |
|---|---|---|---|
| Salamanca | 1,600 - 1,750 | 1,650 - 1,850 | Good |
| Zamora | 1,600 - 1,750 | 1,650 - 1,800 | Good |
| Valladolid | 1,550 - 1,700 | 1,600 - 1,750 | Moderate-Good |
| Ávila | 1,600 - 1,750 | 1,650 - 1,800 | Good |
| Segovia | 1,550 - 1,700 | 1,600 - 1,750 | Moderate-Good |
| Soria | 1,500 - 1,650 | 1,550 - 1,700 | Moderate |
| Palencia | 1,500 - 1,650 | 1,500 - 1,680 | Moderate |
| Burgos | 1,450 - 1,600 | 1,450 - 1,650 | Moderate |
| León | 1,400 - 1,600 | 1,400 - 1,600 | Moderate |
Aragon
| Province | GHI (kWh/m²/year) | DNI (kWh/m²/year) | Classification |
|---|---|---|---|
| Zaragoza | 1,650 - 1,800 | 1,700 - 1,900 | Good |
| Teruel | 1,700 - 1,850 | 1,750 - 1,950 | Good-Very good |
| Huesca | 1,500 - 1,700 | 1,500 - 1,750 | Moderate-Good |
Aragon benefits from the Ebro valley’s wind-cleared skies and is increasingly active in utility-scale PV development, with lower land costs than southern Spain.
Catalonia and Balearic Islands
| Province/Region | GHI (kWh/m²/year) | Classification |
|---|---|---|
| Lleida (inland) | 1,650 - 1,800 | Good |
| Tarragona | 1,650 - 1,800 | Good |
| Barcelona | 1,550 - 1,700 | Moderate |
| Girona | 1,500 - 1,650 | Moderate |
| Balearic Islands | 1,750 - 1,900 | Very good |
Northern Spain
| Region | GHI (kWh/m²/year) | Classification |
|---|---|---|
| La Rioja | 1,550 - 1,700 | Moderate |
| Navarra | 1,450 - 1,650 | Moderate |
| Basque Country | 1,200 - 1,400 | Low |
| Cantabria | 1,100 - 1,350 | Low |
| Asturias | 1,100 - 1,350 | Low |
| Galicia | 1,100 - 1,400 | Low |
How Irradiance Translates to Project Viability
The relationship between GHI and project economics is not linear — it is amplified by the revenue model. A 10% increase in GHI translates to approximately 10% more energy and 10% more revenue, but the fixed costs (O&M, land lease, debt service) remain constant. This means higher irradiance locations have disproportionately better margins.
As a rule of thumb for utility-scale PV in Spain:
- GHI above 1,800 kWh/m²/year: Strong project economics. Most bankable projects in Spain are in this range.
- GHI 1,600-1,800 kWh/m²/year: Viable with competitive capex. Requires careful financial structuring.
- GHI below 1,600 kWh/m²/year: Challenging economics without subsidies. Better suited to self-consumption or community energy projects where the value of locally avoided grid costs changes the calculus.
Seasonal Irradiance Patterns
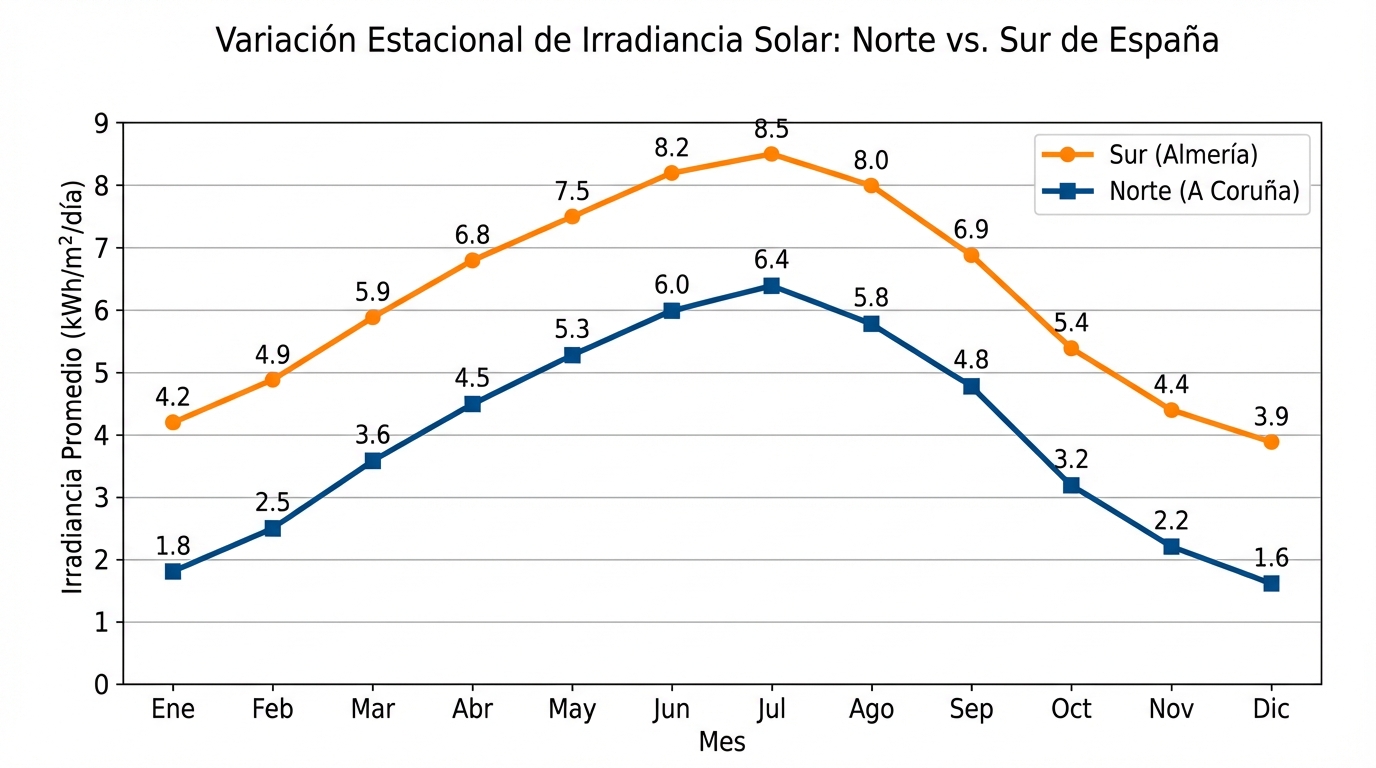
Spain’s solar resource is not uniform throughout the year. Understanding the seasonal profile matters for:
- Revenue forecasting (summer months generate more revenue but at lower market prices due to solar cannibalization)
- O&M scheduling (optimal cleaning windows before peak irradiance months)
- Battery hybridization (maximising value from stored energy in low-irradiance periods)
In southern Spain, June and July typically deliver 250-300% more GHI than December and January. In northern Spain, the seasonal ratio is more moderate at 200-250%.
Tools for Irradiance Analysis
For project sizing and yield assessment, the primary irradiance data sources used in Spain are:
- PVGIS (European Commission): Free tool, widely used for preliminary assessments
- Solargis: Commercial tool with higher resolution data, industry standard for bankable yield assessments
- Meteonorm: Used for detailed hourly simulation inputs
- PV Maps: Provides actual irradiance records at the plant location level, allowing you to compare modelled yield against real-world production
Use the irradiance converter tool to convert GHI data into estimated annual production for specific panel configurations.
Explore the interactive solar irradiance map of Spain with province-level data and historical irradiance records.
View All Data to Explore Plant-Level Irradiance Data
Generic province-level averages are useful for initial site screening. But for serious project development or investment due diligence, you need irradiance data at the specific plant location — and ideally, actual irradiance records from nearby operational plants to validate your yield model.
PV Maps provides both: historical irradiance data at the plant level, cross-referenced with actual production records, so you can see exactly how well (or poorly) yield models have tracked reality for plants in your target region.
view all data to access the full irradiance and production dataset, or explore the solar irradiance section to start your analysis today.