Real ROI of Solar Plants in Spain 2026: Actual Data vs Estimates
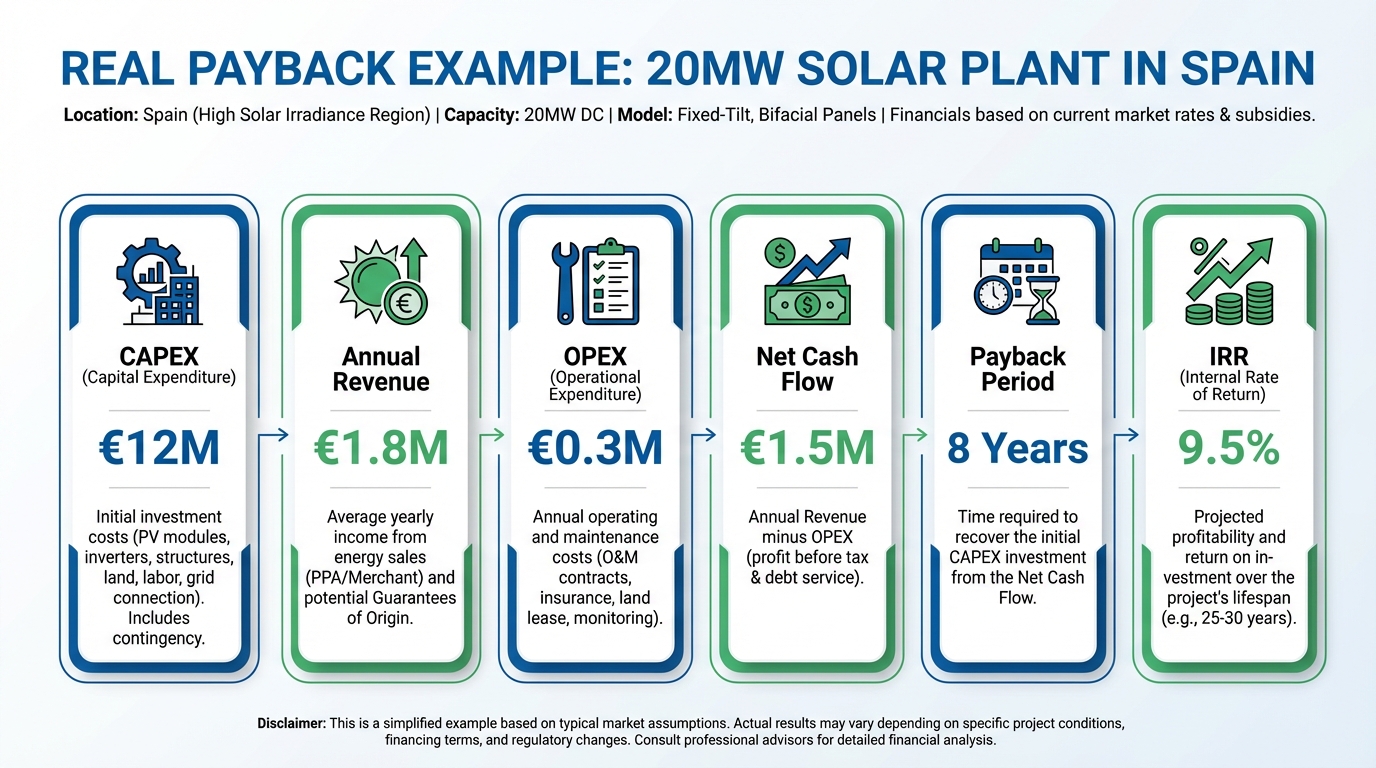
Every investment proposal for a photovoltaic plant in Spain comes with a projected ROI. Every single one. The numbers are typically attractive — payback periods of 7 to 12 years, IRRs of 8 to 14%, revenue projections that look compelling on a spreadsheet.
The problem is that most of those projections are built on estimated data. Consultancies like Aurora Energy Research, AFRY or Modo Energy produce high-quality long-range price forecasts — but they are forecasts. They are not what the plants actually earned last year, or the year before, in the real Spanish electricity market.
This article cuts through the estimates and looks at real ROI data for photovoltaic plants in Spain, drawn from actual OMIE market revenues, real irradiance records and verified operational costs. The picture is more nuanced than the pitch decks suggest.
The Gap Between Projected and Real Revenue
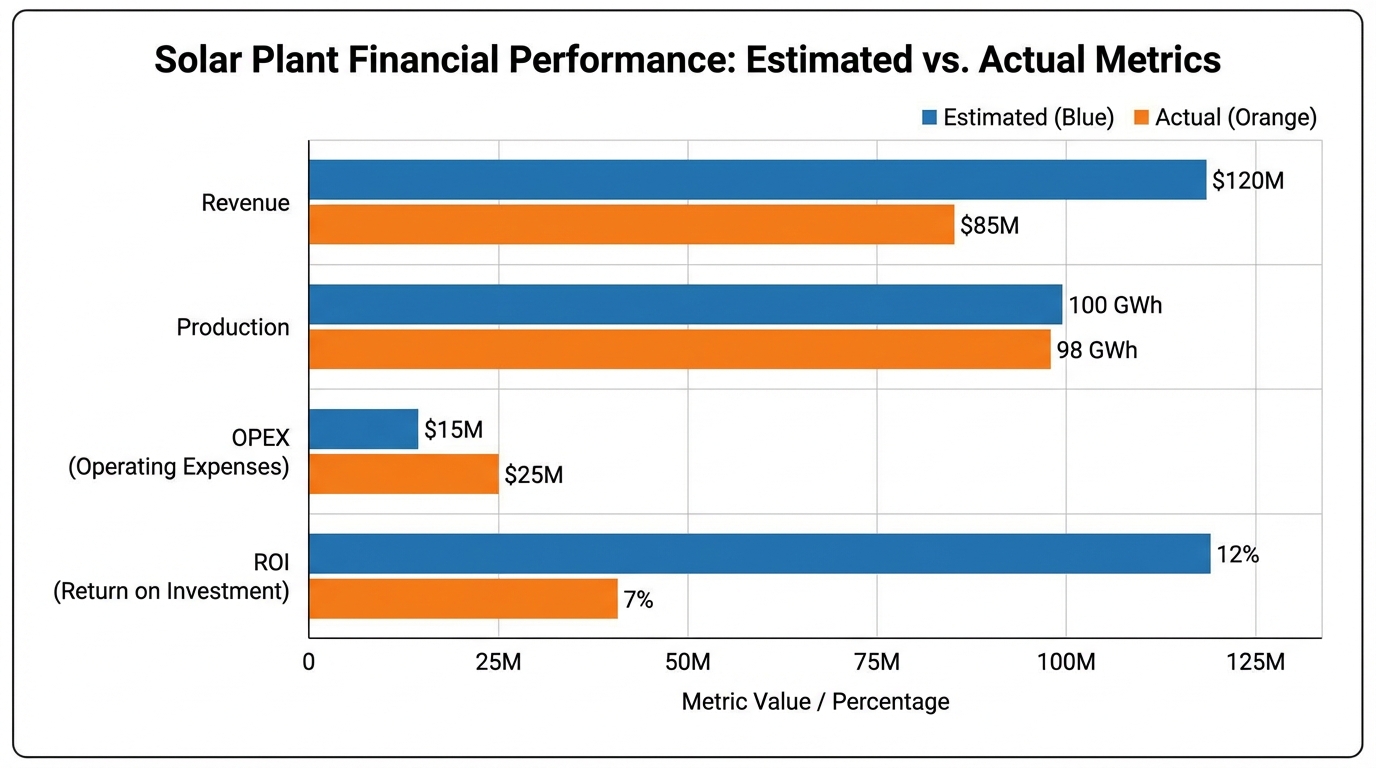
The most consistent finding when comparing projected ROI to actual ROI in Spanish solar plants is a systematic overestimation of revenue in the first 3-5 years of operation, followed by a partial recovery as the plant operator optimises their market strategy.
Why Revenue Projections Overestimate
1. Price capture rate assumptions
A forecast model may assume that a plant captures the average OMIE day-ahead price. In practice, plants sell into a market that is increasingly correlated — when your plant produces, every other solar plant in the region is also producing. This drives the price during solar hours (10:00-16:00) well below the daily average.
In Andalusia and Extremadura, the price capture rate for photovoltaic generation was approximately 18-25% below the baseload OMIE average in 2024, depending on the month and the plant’s flexibility. Projections from 2020-2022 rarely modelled this with sufficient granularity.
2. Curtailment and grid constraints
Grid congestion in high-solar-density regions (southern Spain, Extremadura) means that plants are sometimes instructed to reduce output by the grid operator (REE). Curtailment of 2-5% of potential annual generation is not uncommon. This is rarely modelled at the pre-investment stage.
3. O&M costs drift upward
Initial O&M cost estimates tend to be optimistic. Module degradation, inverter replacements, cleaning frequency in dusty environments (Almería, Murcia) and security costs all tend to come in higher than projected by year 3-5.
Real ROI Benchmarks: What the Data Shows
Based on actual OMIE revenue data for operational plants in Spain tracked by PV Maps, here are realistic benchmarks for utility-scale photovoltaic assets (10-100 MW range):
Revenue per MWp (2024 actual)
| Region | Average Revenue (EUR/MWh) | Annual Revenue per MWp (EUR) |
|---|---|---|
| Extremadura | 42-48 | 68,000 - 78,000 |
| Andalusia | 40-46 | 65,000 - 74,000 |
| Murcia / Valencia | 38-44 | 62,000 - 72,000 |
| Castilla-La Mancha | 44-50 | 71,000 - 81,000 |
| Castilla y León | 44-52 | 68,000 - 80,000 |
These figures assume plants operating in the day-ahead market (OMIE) without a PPA. Plants with long-term PPAs at fixed prices signed in 2020-2022 (at €35-45/MWh) may actually be underperforming relative to market conditions in 2024, depending on the contract strike price.
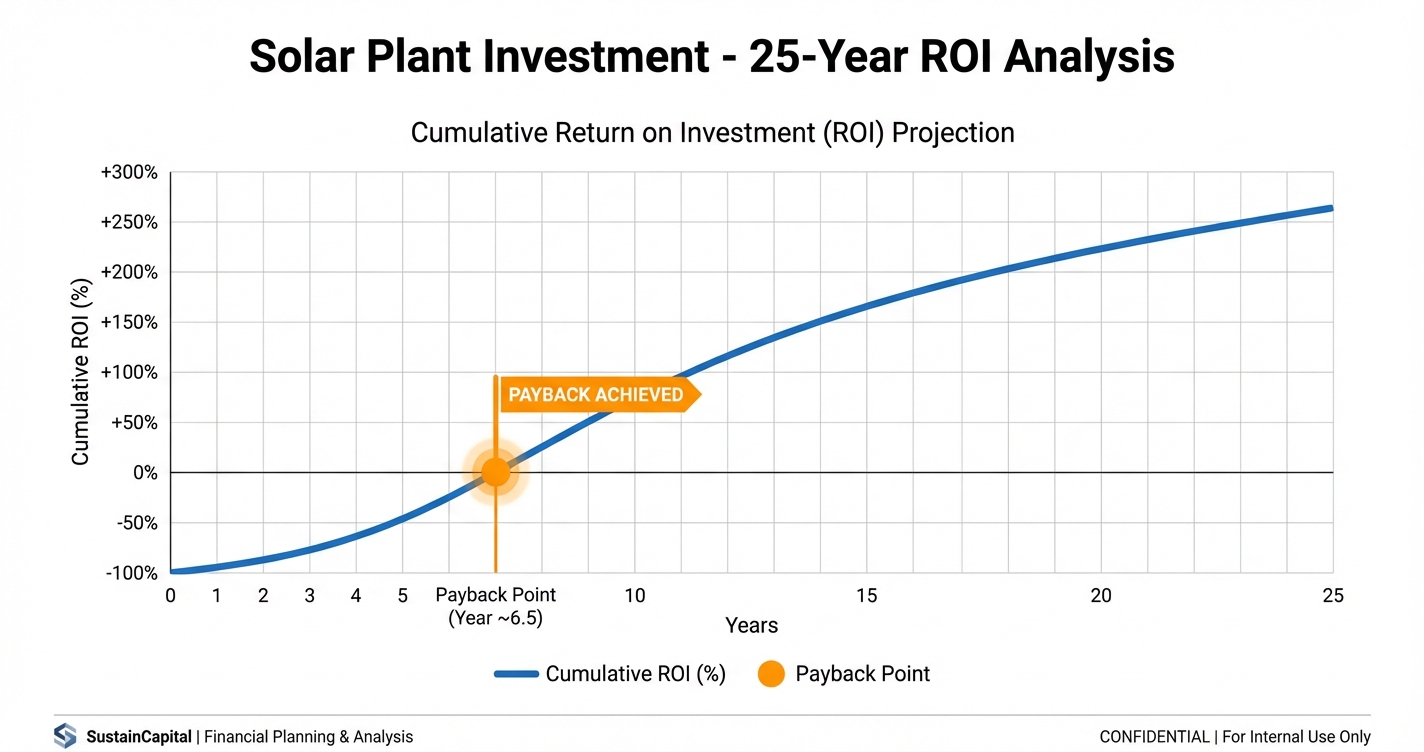
Actual Payback Periods (2026 perspective)
For plants commissioned in 2020-2023 at typical capex levels:
- Low capex (€550,000-620,000/MWp): Payback 9-12 years at current market prices
- Mid capex (€630,000-720,000/MWp): Payback 11-14 years
- High capex (>€750,000/MWp): Payback 14-18 years (often driven by grid connection costs or complex terrain)
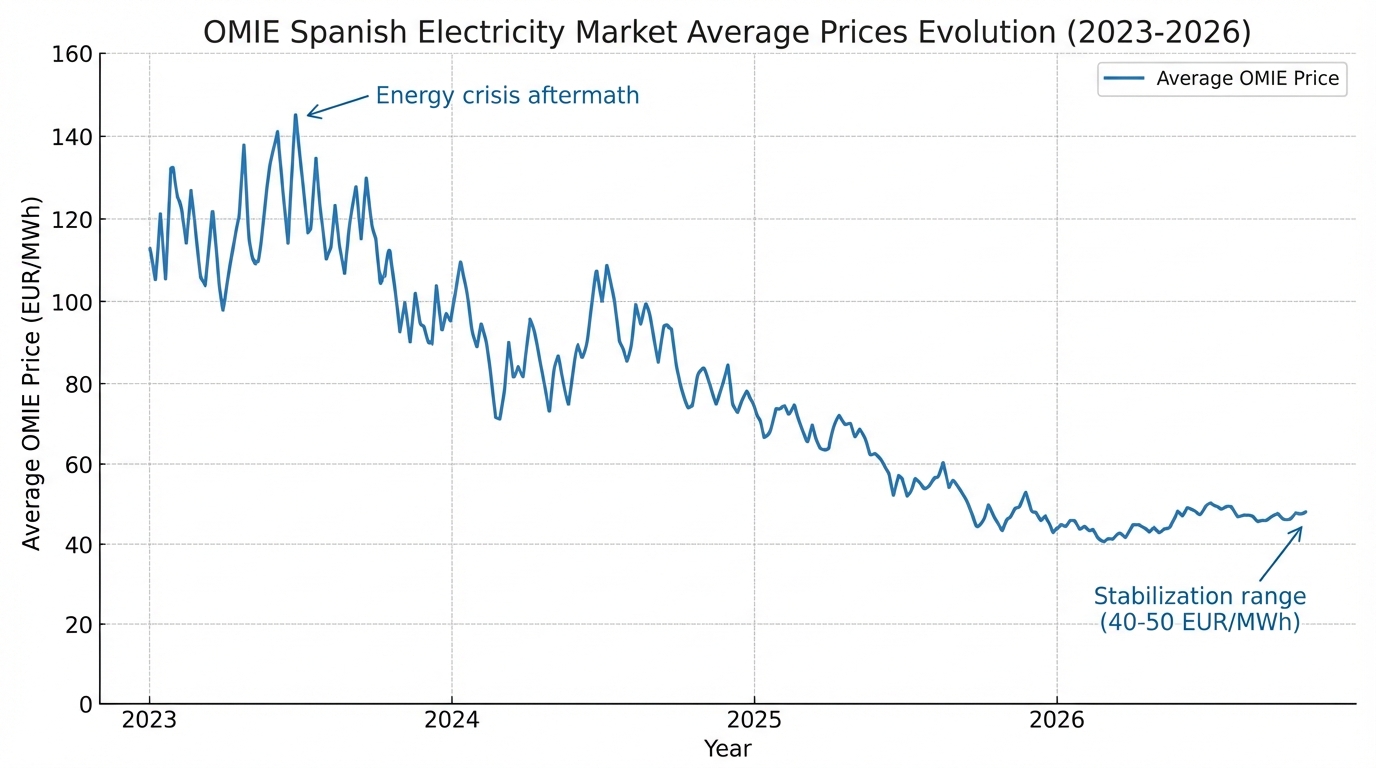
These are materially longer than the 7-9 year payback figures that appeared frequently in investment memos from 2019-2022, when OMIE prices were assumed to average €50-60/MWh through the decade.
The PPA Factor: Locked In at the Wrong Price?
Spain saw a wave of PPA signings in 2020-2022 when corporate buyers (large industrials, data centres, multinationals) were eager to sign long-term offtake agreements at fixed prices to meet sustainability targets.
Those PPAs were struck at prices ranging from €35 to €52/MWh, typically for 10-15 year terms.
When OMIE wholesale prices spiked in 2021-2022 above €150/MWh due to the energy crisis, PPA-contracted plants missed the upside entirely — their fixed-price contracts were suddenly a significant financial drag.
Conversely, when wholesale prices normalised in 2023-2024 to the €40-60/MWh range, many of those same PPAs became fair-value or even slightly below market. The lesson: PPA pricing is a two-edged sword, and the actual ROI depends heavily on which side of the market you are on.
How to Verify ROI Before Investing
The most important shift in photovoltaic investment due diligence is moving from forecast-based to data-based analysis. Here is a practical framework:
Step 1: Check Actual Production Against P50
For any plant you are evaluating, request the actual MWh production records for the last 3-5 years and compare them to the pre-construction P50 yield assessment. A well-performing plant should track its P50 within ±5%. Consistent underperformance versus P50 signals module degradation, soiling losses or O&M gaps.
Step 2: Verify Market Revenue Against OMIE Records
OMIE publishes historical market prices at the hourly level. You can cross-reference declared production with price curves to independently verify revenue claims. PV Maps provides this analysis directly — you can see actual income per plant per year without relying on the seller’s own reporting.
Step 3: Normalise by Irradiance
Not all production underperformance is operational failure. A year with below-average irradiance will naturally reduce output. Before drawing conclusions, normalise production against actual irradiance data for the plant location. PV Maps includes irradiance records at the plant level, allowing apples-to-apples comparison across years.
Step 4: Model Forward Revenue Conservatively
Use the revenue calculator to stress-test revenue projections under different market price scenarios — base case, downside (€35/MWh average) and upside (€60/MWh average). Do not build your investment case on the upside scenario alone.
The IRR Reality Check
A project IRR of 10-12% is genuinely achievable for well-sited, efficiently operated photovoltaic plants in Spain in 2026. But achieving it requires:
- Buying at the right capex: The secondary market in Spain has seen compressed yields as more capital has chased fewer quality assets. Overpaying by 10-15% on acquisition price can reduce IRR by 2-3 percentage points.
- Active market management: Plants operated passively in the day-ahead market consistently underperform plants with active intraday trading, ancillary services participation (REE balancing market) and dynamic curtailment management.
- Controlling O&M costs: Competitive O&M contracts (€8,000-12,000/MWp/year range for utility-scale plants) make a material difference to levered equity returns, especially in years 5-15.
Frequently Asked Questions
What is a realistic IRR for a solar plant in Spain in 2026?
For new-build assets at current capex levels, unlevered project IRRs of 7-10% are typical. With debt financing (60-70% leverage at competitive rates), equity IRRs of 10-14% are achievable for well-managed projects in high-irradiance locations.
Does a PPA improve or reduce ROI?
It depends on the strike price relative to future market prices. A PPA reduces revenue volatility — which lenders value — but locks in upside. At current market dynamics, short-term PPAs (5-7 years) at market-reflective pricing tend to offer the best risk-adjusted return profile.
How does Spain compare to other European markets for solar ROI?
Spain remains one of the most attractive solar investment markets in Europe due to its irradiance advantage. A 1 MWp plant in Extremadura generates 25-35% more energy than an equivalent plant in Germany or France, which directly improves revenue per unit of capex invested.
Access Real Revenue Data for Spanish Solar Plants
Stop making investment decisions based on estimates. The actual revenue data for photovoltaic plants in Spain is available — and it tells a more precise story than any forecast model.
Explore real energy generation and revenue data for solar plants across Spain, updated with actual OMIE market results.
Use the revenue calculator to model ROI scenarios with real market price inputs.
Or view all data to see how PV Maps can support your investment screening and due diligence workflow.