Who are the largest solar plant owners in Spain (2026)
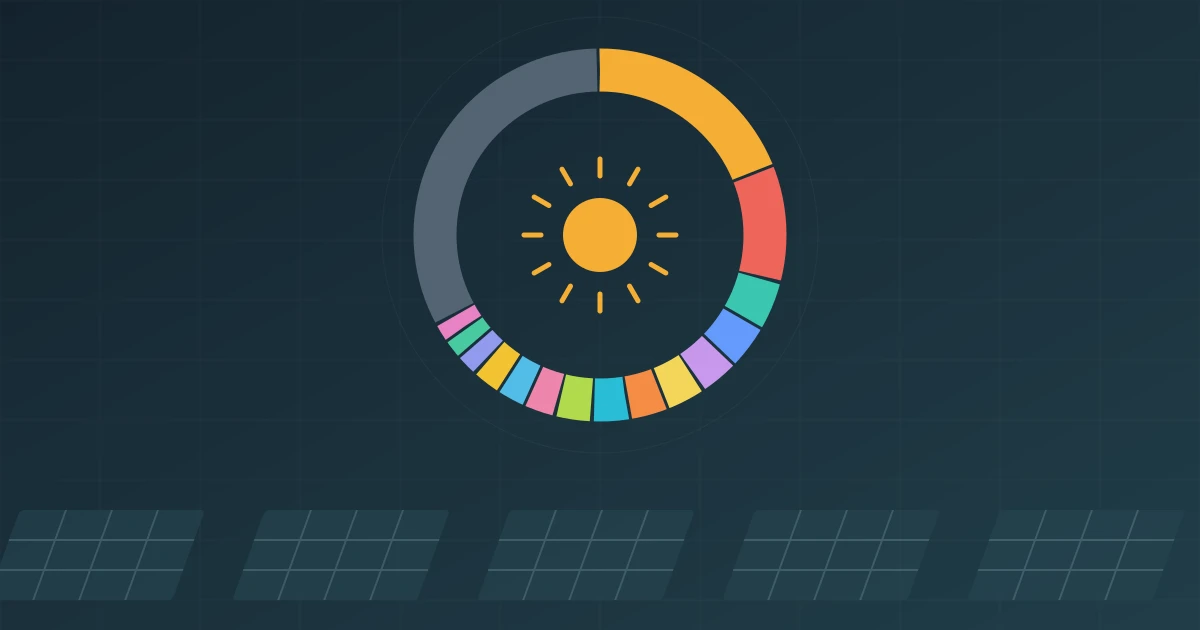
The relative capacity distribution of operational solar PV assets characterised by PV Maps as of 22 September 2026.
15 groups account for 67.2% of the solar PV capacity characterised in this analysis. The remaining 32.8% is spread across other owners. Many plants belong to the same corporate group: the ownership map reveals that concentration.
At PV Maps, we identify the owners of operational solar PV assets, plant by plant. This analysis uses a snapshot as of 22 September 2026 of the characterised assets to compare relative portfolio shares and the corporate structures behind the main names.
How to read the figures: percentages describe the capacity distribution of the solar PV assets characterised for this analysis, taking that set as 100%. They are not shares of Spain’s entire fleet or percentages of the number of plants. BESS storage is excluded from this distribution.
The ownership map, company by company
Switch between the doughnut and bar ranking to compare relative portfolio shares. Select a segment or company to see its share and corporate control. “Other owners” combines those outside the Top 15.
Fifteen groups. Two thirds of the capacity.
Compare portfolio shares and select a company to see its share and corporate control.
Share of the solar PV capacity characterised in this PV Maps analysis.
Relative distribution of characterised capacity · PV Maps, 22 September 2026.
Concentration in numbers
The Top 15 represents 67.2% of the distribution analysed, compared with 32.8% held by other owners. Two large groups stand out:
- Iberdrola ranks first with 19.04% of the sample. Its relative share is approximately 1.9 times that of the second-largest owner.
- Endesa-Enel ranks second with 10.20%. Together, the two groups account for 29.25% of the characterised capacity.
- Galp ranks third with 4.28%. From fourth place onwards, no individual group exceeds 4%.
- Outside the Top 15 sits 32.8% of the sample: a sizeable, fragmented segment that also deserves commercial attention.
The gap between the first two groups and the rest is considerable. Understanding this market requires looking at both the largest portfolios and the owners outside the ranking.
Top 15 owners of solar PV capacity
Shares reflect the relative weight of assets attributed to each group within the characterised set. The last column identifies the group’s headquarters or reference shareholder where an international parent or investment platform is involved.
| # | Owner group | % of sample | Headquarters / reference shareholder |
|---|---|---|---|
| 1 |  Iberdrola Iberdrola | 19.04 % | Spain · listed group |
| 2 |  Endesa-Enel Endesa-Enel | 10.20 % | Italy · controlled by Enel |
| 3 |  Galp Galp | 4.28 % | Portugal · energy group |
| 4 |  Naturgy Naturgy | 3.86 % | Spain · listed group with international investors |
| 5 |  Solaria Solaria | 3.41 % | Spain · listed group |
| 6 |  China Three Gorges China Three Gorges | 3.40 % | China · China Three Gorges group |
| 7 |  Elawan Energy Elawan Energy | 3.35 % | Japan · ORIX |
| 8 |  Repsol Repsol | 3.29 % | Spain · listed group |
| 9 |  Bruc Energy Bruc Energy | 3.23 % | Spanish management · OPTrust, USS and Interogo; portfolio-specific structures |
| 10 |  Recurrent Energy Recurrent Energy | 2.74 % | Canadian Solar · minority stake held by BlackRock |
| 11 |  FRV FRV | 2.54 % | Saudi Arabia · Jameel Energy |
| 12 |  Encavis Encavis | 2.52 % | KKR-led consortium · Viessmann as co-investor |
| 13 |  Opdenergy Opdenergy | 1.93 % | Antin Infrastructure Partners · Spanish origins |
| 14 |  Matrix Renewables Matrix Renewables | 1.74 % | United States · platform backed by TPG |
| 15 |  TotalEnergies TotalEnergies | 1.65 % | France · energy group |
| Top 15 | 67.20 % | ||
| Other owners | 32.80 % |
Source: PV Maps, 22 September 2026. Rounded individual shares may not add up exactly to the aggregate.
Spanish headquarters and corporate control: two different perspectives
A company can operate from Spain while belonging to an international group. A listed Spanish company can also have foreign investors without being controlled by a single foreign parent. Headquarters, corporate control and the nationality of all invested capital are different concepts.
To avoid mixing them, we distinguish three categories within the Top 15:
WITHIN THE TOP 15 · PERCENTAGE OF THE ENTIRE SAMPLE
All bars use a scale from 0 to 67.2% (the Top 15). The remaining 32.8% is not classified by capital origin.
- Spanish groups with no identified foreign controlling parent: 29.6% of the sample. This includes Iberdrola, Naturgy, Solaria and Repsol. This category does not imply that all their shareholders are Spanish; Naturgy, for example, has international investors.
- Groups with an international parent or controlling investment platform: 34.4%. This includes Endesa-Enel, Galp, China Three Gorges, Elawan, Recurrent Energy, FRV, Encavis, Opdenergy, Matrix Renewables and TotalEnergies.
- Bruc, considered separately: 3.2%. It combines Spanish management with international investors. Group-level shareholdings and investments in specific portfolios do not automatically establish the same control structure for every asset.
Groups in the second category hold more capacity than those in the first, even with Bruc excluded. This compares corporate control within the Top 15, not the nationality of every ultimate investor.
The shareholders behind some familiar names
Endesa has Enel as its controlling shareholder, as shown in its shareholder structure. Elawan, headquartered in Spain, belongs to ORIX, which reports a 100% stake. FRV is part of Jameel Energy: the company documents its acquisition by Abdul Latif Jameel Energy in 2015.
Opdenergy identifies Antin Infrastructure Partners as its majority shareholder. Its shares were delisted in April 2024, so describing it as a listed Spanish company would be inaccurate for this snapshot.
For Encavis, the delisting documentation identifies a KKR-led consortium, with Viessmann as co-investor. Its German origins alone do not describe its control structure.
Recurrent Energy has Canadian Solar as its majority shareholder; BlackRock acquired a 20% stake in 2024. Matrix Renewables is a platform backed by TPG. China Three Gorges Europe is part of CTG’s international structure.
For Bruc, the documentation distinguishes Interogo’s investment in a portfolio of assets from OPTrust and USS shareholdings in the wider group. We therefore show it separately, without treating the presence of international funds as sufficient evidence of the control structure of every plant.
Three types of owner in the ranking
Business strategies also help explain these portfolios. The profiles can overlap:
- Utilities and integrated groups: Iberdrola, Endesa-Enel, Naturgy, Repsol, Galp and TotalEnergies combine solar PV with other energy activities.
- Platforms backed by investment funds: Matrix, Bruc, Encavis and Opdenergy channel institutional investment through different group and portfolio structures.
- Independent power producers and specialist developers: Solaria, Elawan, FRV and Recurrent Energy focus on renewables. “Independent” describes their business model, not the absence of a parent company.
The other 32.8%: beyond the Top 15
The remaining 32.8% belongs to owners outside the Top 15. This is a relevant segment for O&M, market representation, investment and consulting teams looking for opportunities beyond the largest names.
Portfolio size alone does not show that assets are for sale or that an owner will consolidate with another. It does not reveal profitability either. Assessing an opportunity requires examining the asset itself: identifying the owner, understanding the corporate group, checking technical data and analysing operations.
How to use the ranking in your work
The next step depends on your objective. These three routes turn the ranking into an analysis of specific assets:
O&M
Define a portfolio to approach
Choose an area, identify each group’s plants and compare capacity, technology and commissioning dates. Check who makes procurement decisions before preparing an offer.
For example: group nearby assets to assess a combined maintenance proposal.
OutcomeA list of assets and decision-makers for a specific service offer.
Market representation
Prepare a revenue comparison
Identify the owner and select assets with comparable locations and technologies. Compare normalised generation and revenue to investigate differences in market operation.
For example: compare revenue per MWh for similar plants over the same period.
OutcomeA market representation proposal supported by verifiable comparisons.
Investment
Select assets for further investigation
Filter portfolios by size and area. Then verify legal ownership, corporate structure, technical data and historical revenue before building acquisition scenarios.
For example: shortlist a portfolio for due diligence and check its actual revenue; inclusion in the ranking does not mean it is for sale.
OutcomeAn initial shortlist with the outstanding checks identified.
Methodology and limitations
This article preserves the historical PV Maps snapshot as of 22 September 2026 and presents its results in relative terms. The starting source is a summary aggregated by owner of operational solar PV assets characterised for the analysis. The Top 15 represents 67.2% of that set.
Plant owner, corporate group and shareholder
The legal owner may be a project company. The corporate group brings together companies linked to a parent. A shareholder holds an interest in a company or portfolio. The ranking presents the relative weight of the groups identified in the source; it does not count each subsidiary or shareholder as an additional owner.
Plant attribution comes from that snapshot, not a new query of the current database. The aggregate source does not include the full ownership chains or the treatment of each jointly owned asset. Those relationships are therefore not reconstructed from a trading name or a fund’s nationality.
Shared ownership and duplicates
Capacity is not allocated to shareholders in proportion to their stakes: a minority shareholding does not add a second portfolio to the ranking. Investment in a specific portfolio is not extrapolated to every plant in a group, as the Bruc example illustrates.
Without the historical plant list and its identifiers, this article cannot audit the absence of duplicates or verify the attribution of every jointly owned asset. Using these figures for a specific transaction requires checking each installation’s legal owner, control chain and capacity.
Calculations and coverage
Calculations follow these rules:
- Group share: the proportion of capacity attributed to the group within the characterised set, normalised to 100%. Table shares use two decimal places; summaries use one, except for the combined share of the two largest groups.
- Other owners: the difference between 100% of the analysed set and the Top 15 share. No shareholder structure is inferred for this segment.
- Corporate control: an editorial classification supported by public corporate information available before the cutoff and linked in the article. It does not classify the nationality of every ultimate investor.
- Coverage: the figures describe the set characterised for this snapshot, not Spain’s entire solar PV fleet. Projects under development, self-consumption installations and energy communities are not added without evidence that they are included in that set.
- Technology: the distribution is weighted by solar PV capacity, not the number of installations. BESS storage capacity does not contribute to these percentages.
Acquisitions, asset sales, new connections and further characterisation can change relative portfolio shares. This publication preserves the reference snapshot; a plant-by-plant ownership audit requires historical asset-level records.
From the ranking to the owner of each plant
Knowing which groups hold the largest portfolios is the first step. To act on an opportunity, you need to know who is behind a specific installation and how to contact them.
PV Maps brings together ownership, technical information, generation and revenue data for assets recorded in the platform. Start with our guide to identifying the owner of a solar plant.
Looking for new portfolios for O&M, market representation or investment? Let’s discuss the assets you need to identify.