Curtailment in Solar Plants: Causes, Costs, and How to Avoid It
Introduction
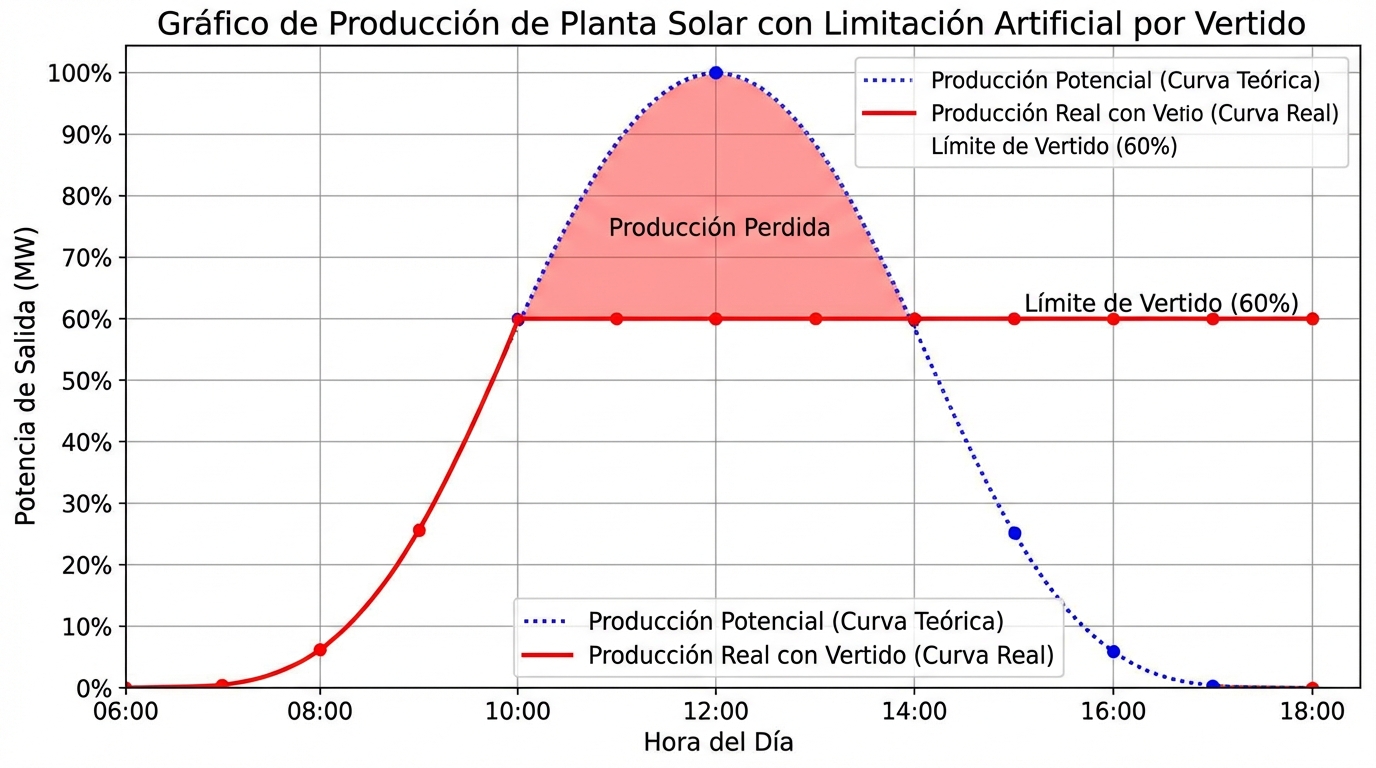
It’s midday on a sunny day at your 25 MWp photovoltaic plant in Extremadura. The inverters are purring at full power, producing 23 MW. Your monitoring system shows everything working perfectly: PR at 85%, no alarms, no failures. Then you get a call: “REE has ordered a production reduction to 60% for the next 4 hours”.
You’ve just experienced your first curtailment (forced production reduction). In those 4 hours, you’ll lose approximately 36 MWh of production. At 40 €/MWh, that’s 1,440 € that evaporate. And the worst part: no one will compensate you for that energy you couldn’t sell.
If your plant is in an area with high curtailment (> 5% annually), this can mean losses of 50,000-150,000 € per year. Enough to ruin your financial model if you hadn’t anticipated it in the development phase.
In this article, we’ll break down what exactly curtailment is, why it occurs, how much money you lose, which areas of Spain are most affected, and the most effective mitigation strategies (including batteries, connection point optimization, and compensation negotiation in PPA contracts).

1. What Is Curtailment and Why Does It Occur?
Curtailment (from “to curtail” = reduce, limit) is the forced reduction of production from a renewable plant ordered by the system operator (Red Eléctrica de España - REE) for technical or economic reasons.
Types of Curtailment
| Type | Cause | Frequency | Compensation |
|---|---|---|---|
| Technical | Grid saturation, transformer restrictions | Structural in certain areas | ❌ Usually not |
| Safety | Line maintenance, system emergencies | Sporadic | ❌ No |
| Economic | Negative prices, excess renewable production | 5-10 days/year | ⚠️ Depends on contract |
| Contractual | Order from your utility (rare) | Very rare | ✅ Per PPA contract |
In Spain, technical curtailment due to grid saturation is the most problematic because it affects recurrently and is not compensated.
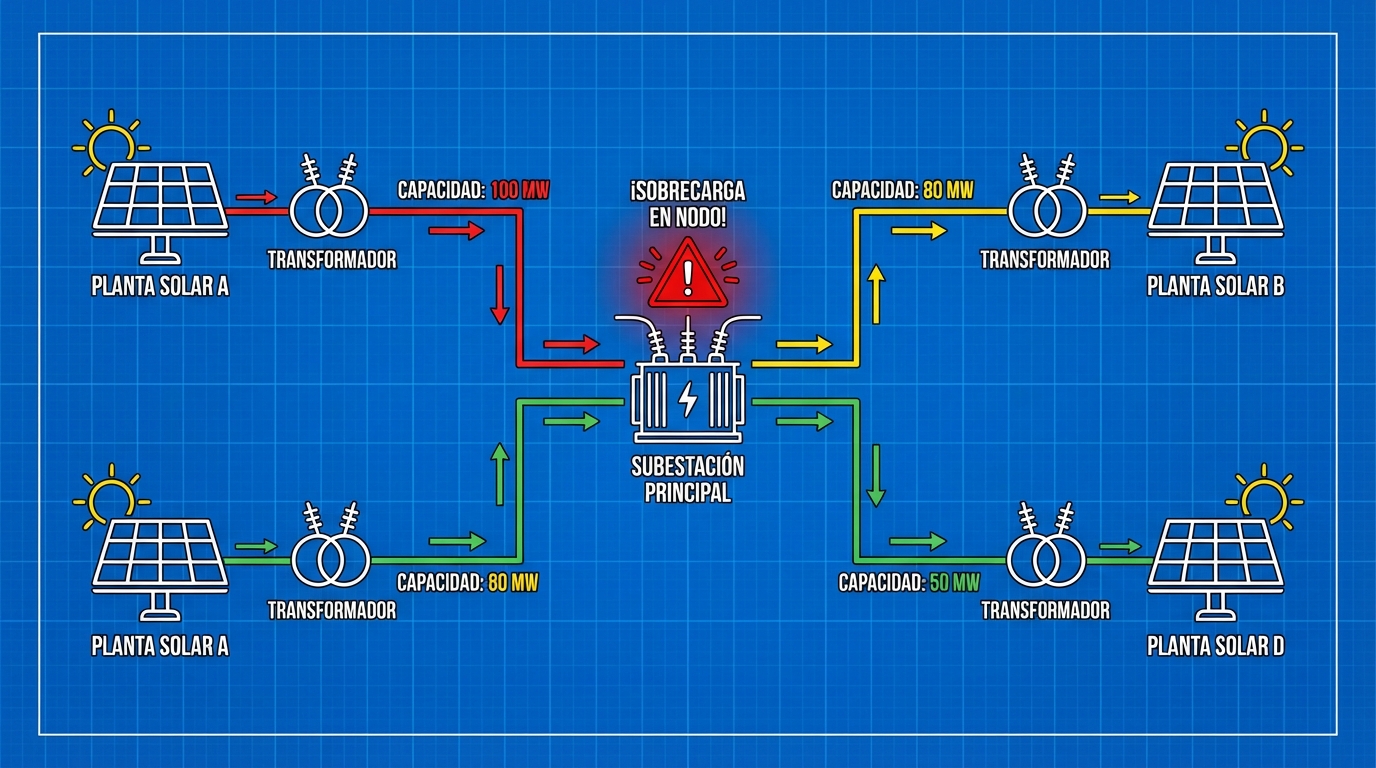
Why Does Technical Curtailment Occur?
The Spanish electrical grid was designed decades ago for conventional generation plants (coal, nuclear, gas) located near consumption centers. The renewable explosion (2019-2025) has created a geographic mismatch:
Problem: Lots of solar generation in areas with little local demand and limited grid
Critical Zones:
- Extremadura: 5,000 MW of installed solar, population 1 million inhabitants
- Castilla-La Mancha: 7,000 MW of solar, grid sized for 2,000 MW
- Aragón (south): High concentration of plants at few connection nodes
Result: During high irradiation hours, the grid cannot evacuate all the solar energy produced → REE orders production reduction.
2. How Much Money Do You Lose with Curtailment?
The economic impact of curtailment is measured in percentage of annual production lost.
Curtailment Loss Calculation
Basic formula:
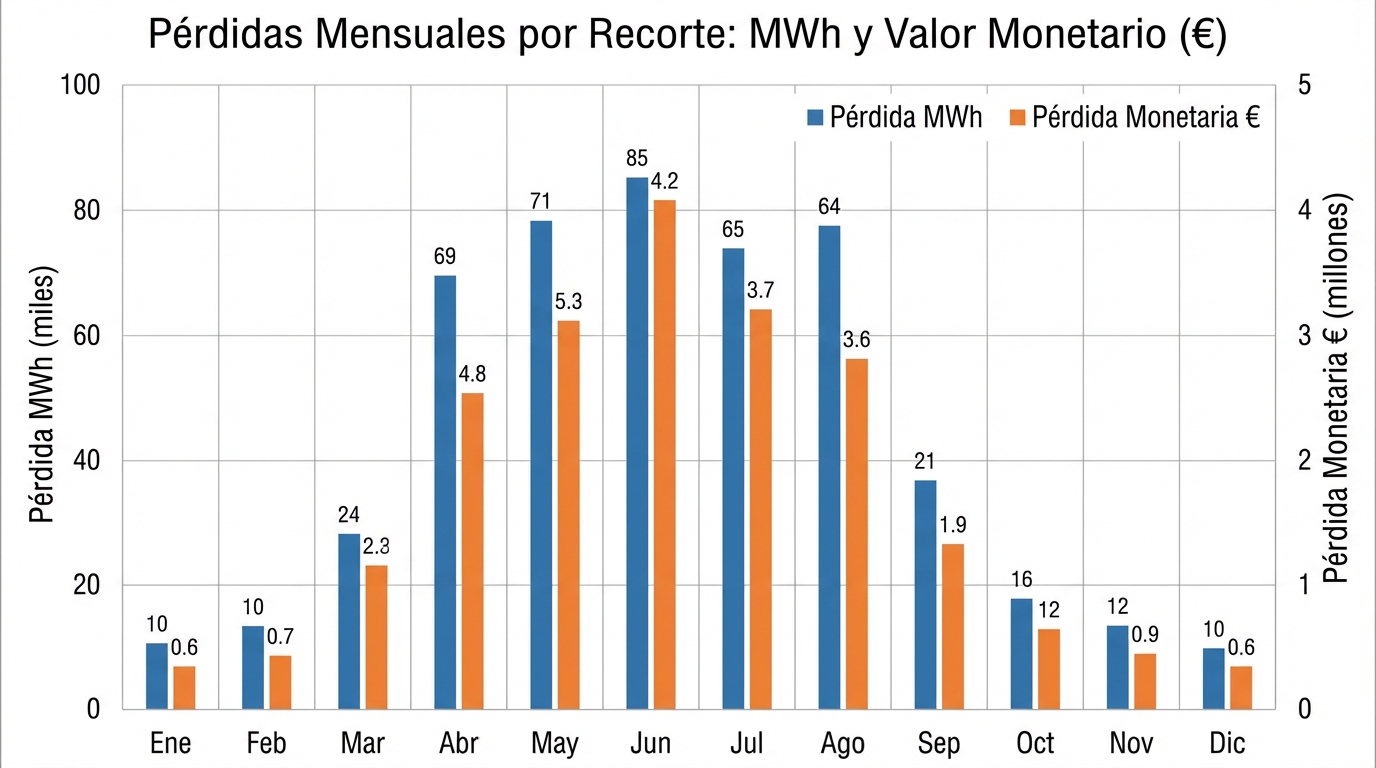
Real example (25 MWp Plant at saturated node):
| Month | Theoretical Production (MWh) | Curtailment (%) | Lost Production (MWh) | Losses @ 40 €/MWh |
|---|---|---|---|---|
| January | 2,500 | 2% | 50 | 2,000 € |
| February | 2,800 | 3% | 84 | 3,360 € |
| March | 3,500 | 5% | 175 | 7,000 € |
| April | 4,000 | 8% | 320 | 12,800 € |
| May | 4,200 | 10% | 420 | 16,800 € |
| June | 4,500 | 9% | 405 | 16,200 € |
| July | 4,800 | 8% | 384 | 15,360 € |
| August | 4,600 | 7% | 322 | 12,880 € |
| September | 3,800 | 6% | 228 | 9,120 € |
| October | 3,200 | 4% | 128 | 5,120 € |
| November | 2,600 | 2% | 52 | 2,080 € |
| December | 2,300 | 1% | 23 | 920 € |
| TOTAL | 42,800 | 5.5% | 2,591 | 103,640 € |
Financial impact:
- Revenue loss: 103,640 €/year
- Over 25 years (net present value @ 5% discount): ~1.5 M€
- % of plant value: 10-15% of total transaction value
Conclusion: 5% annual curtailment can reduce your plant’s value by 10-15% in an M&A transaction.
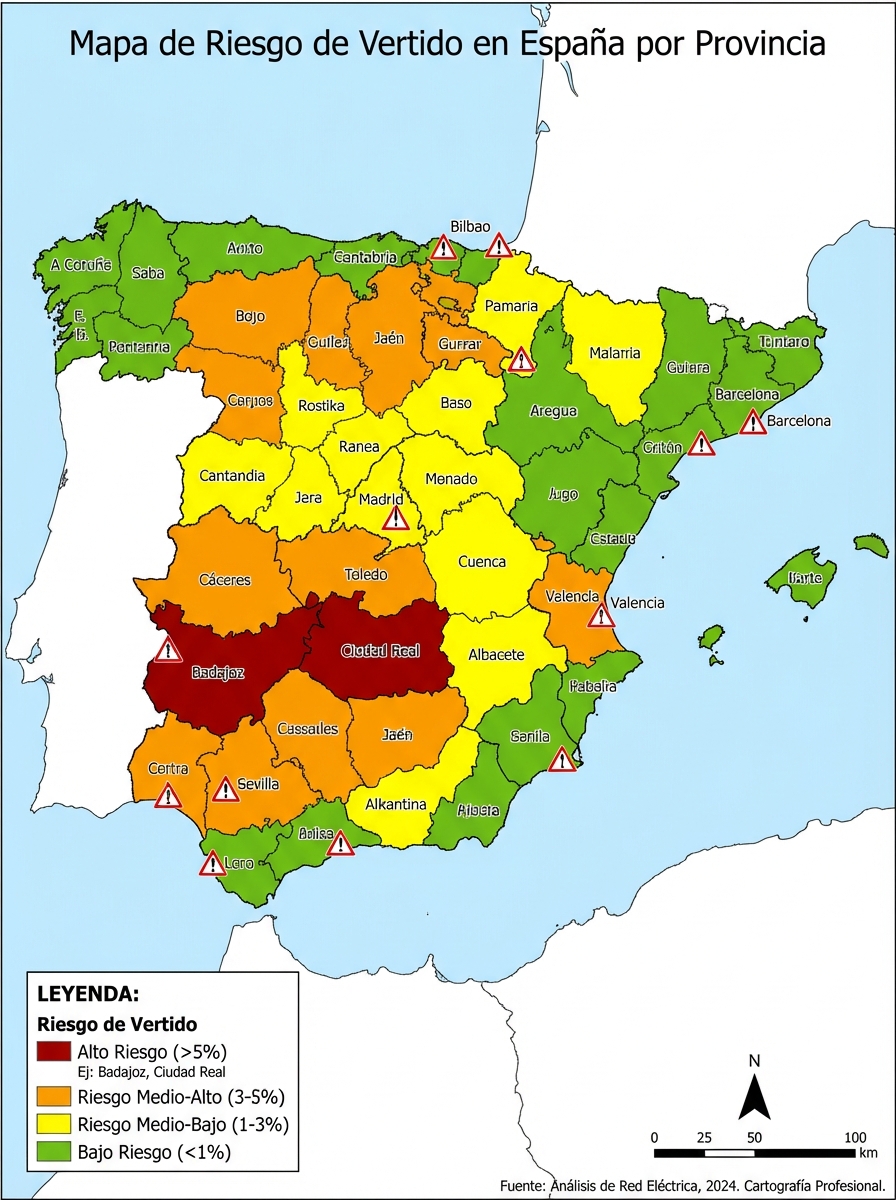
3. Map of High Curtailment Zones in Spain
Not all regions suffer curtailment equally. Here’s the risk map updated to 2026:
Critical Zones (Curtailment > 5% annually)
| Province | Critical Nodes | Installed Solar Power | Average Curtailment | Main Cause |
|---|---|---|---|---|
| Badajoz | Bienvenida, Guillena, Cedillo | 2,500 MW | 6-8% | Portugal line saturation |
| Ciudad Real | Puertollano, Almodóvar | 1,800 MW | 5-7% | Limited substation |
| Toledo | Torralba, Consuegra | 1,500 MW | 4-6% | Weak internal grid |
| Albacete | Elche de la Sierra | 1,200 MW | 5-8% | Saturated Levante connection |
| Teruel (south) | Muniesa, Samper | 800 MW | 4-6% | Limited regional grid |
Moderate Zones (Curtailment 2-5% annually)
- Zaragoza (south): 3-4%
- Murcia (interior): 2-4%
- Sevilla (north): 2-3%
Low Risk Zones (Curtailment < 2% annually)
- Andalucía (coast): Better meshed grid
- Castilla y León: Lower plant concentration
- Comunidad Valenciana: Reinforced grid
Tool: Use REE’s real-time curtailment map to check active restrictions at your node.
4. Root Causes: Why the Problem Isn’t Solved
If curtailment costs millions to generators, why isn’t the grid reinforced? The answer is complex:
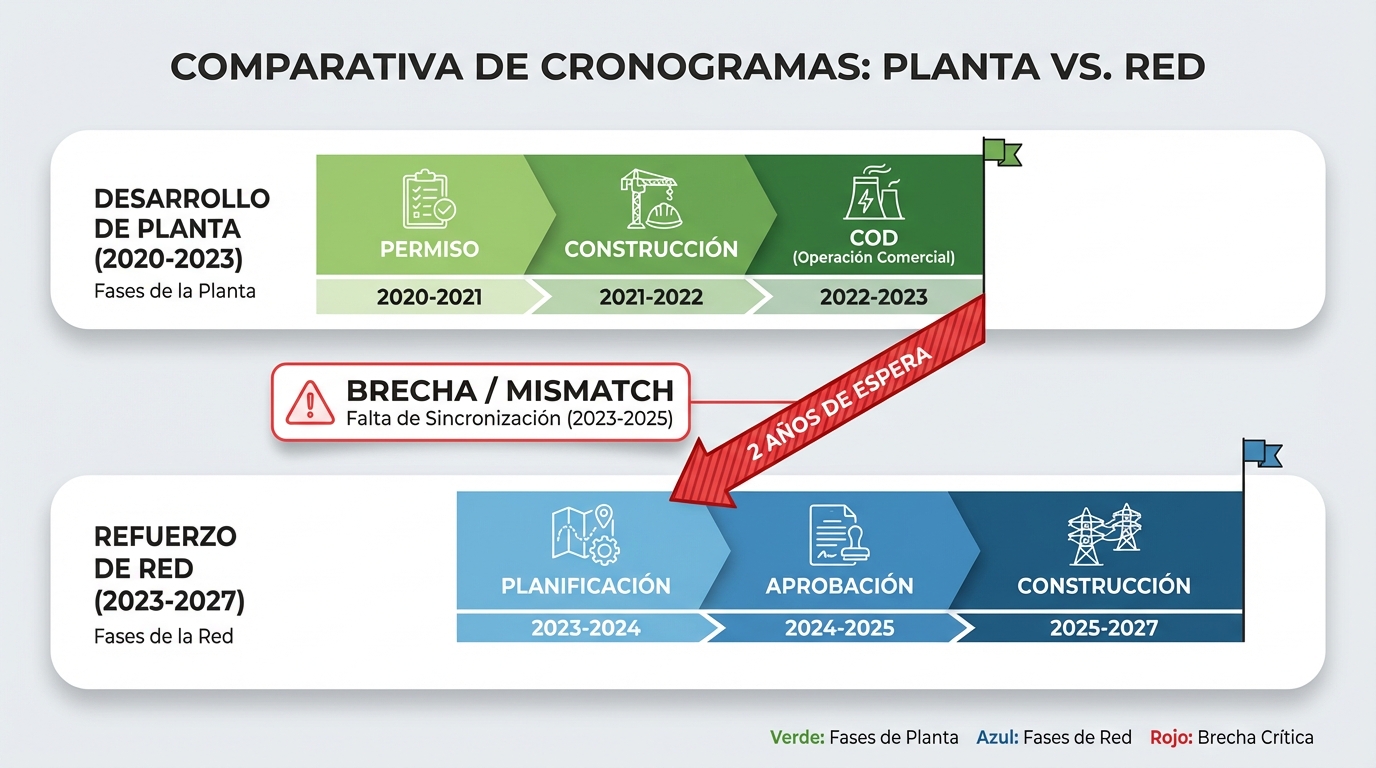
Cause 1: Development Miscoordination
Problem: Plants are built before grid reinforcements
Real example (Bienvenida Node, Badajoz):
- 2018-2020: Permits approved for 2,000 MW of solar
- 2021: Plants are built (COD between 2021-2023)
- 2023: REE starts grid reinforcement studies
- 2025: Grid still not reinforced
- Result: 1,500 MW operational with 7% structural curtailment
Lesson: Access and connection permits don’t guarantee actual evacuability.
Cause 2: Reinforcement Cost Assumed by REE (But Slow)
- REE must reinforce the transmission grid (high voltage)
- But has limited budget and multiple priorities
- Typical reinforcement time: 3-5 years from approval to execution
Example: Extremadura-Portugal reinforcement (new 400 kV line):
- Cost: 200 M€
- Timeline: 2023-2027
- Benefit: Will reduce curtailment from 7% to 2% in Badajoz
- But: Plants have been losing money for 3 years while waiting
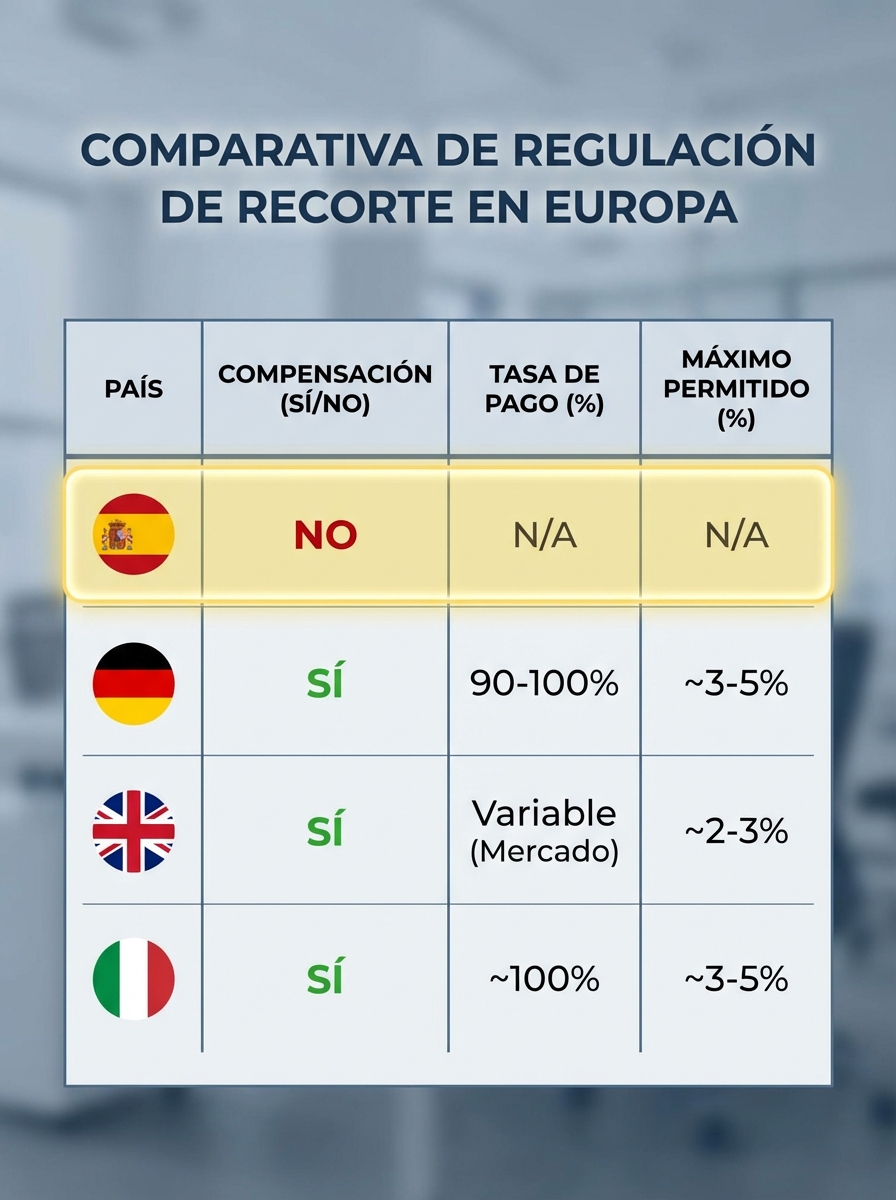
Cause 3: Lack of Legal Compensation
In Spain, there is NO legal obligation to compensate technical curtailment (unlike Germany or UK).
Implication: REE can order production reduction without paying anything → generators bear the cost
Legislative proposal under discussion (2026):
- Compensate curtailment > 3% annually
- Payment at 80% of market price
- But not yet approved
5. Mitigation Strategies (Before Building)
If you’re in the development phase, you can avoid the problem with diligence:
Strategy 1: Node Due Diligence
Before signing access and connection contract, investigate:
Due diligence checklist:
- How many MW of solar are already connected at this node?
- What is the node’s evacuation capacity? (request from distributor)
- Are grid reinforcements planned? When?
- Curtailment history at plants already operating at the node (request data from REE)
Tool: Use REE’s access capacity map to see saturated nodes.
Rule of thumb:
- Node with installed power / evacuation capacity ratio > 1.2 → high curtailment risk
- Example: Node with 500 MW capacity and 650 MW of installed solar → ratio 1.3 → ⚠️ RISK
Strategy 2: Negotiate Alternative Connection Point
If the preferred node is saturated, look for alternatives:
Real case:
- Developer had permit to connect 30 MWp at saturated node (6% expected curtailment)
- Negotiated with distributor to connect at neighboring node (8 km farther)
- Additional cost: 500,000 € in connection line
- Benefit: 0% curtailment → savings of 70,000 €/year
- Payback: 7 years
Conclusion: Sometimes, paying more to connect at a better node is worth it.
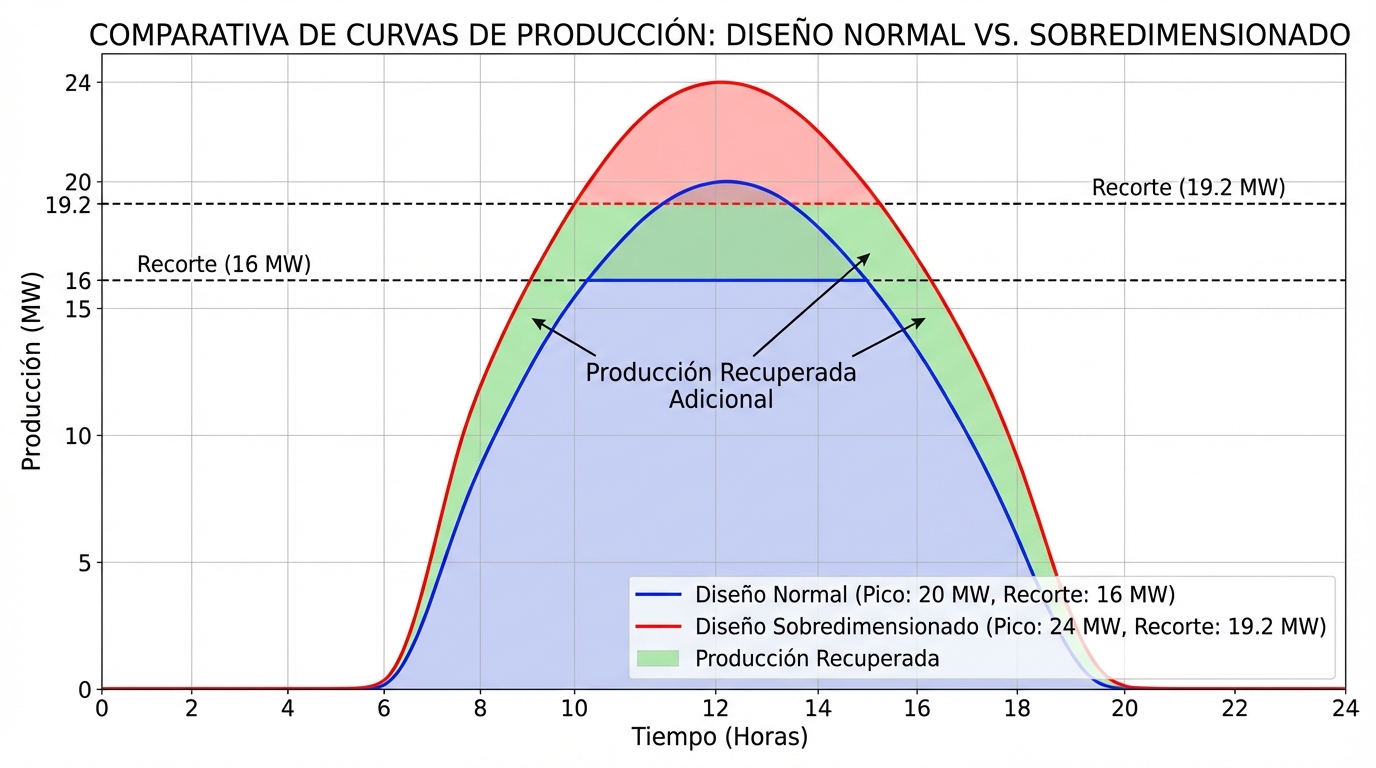
Strategy 3: Design with Conscious Oversizing
If you know there will be curtailment, you can oversize the plant:
Logic:
- Curtailment occurs during peak hours (12:00-16:00)
- If you size to deliver 20 MW at peak, but they cut you to 80%, you only deliver 16 MW
- If you size to deliver 24 MW and they cut you to 80%, you deliver 19.2 MW (almost the 20 MW you wanted)
Financial calculation:
- Additional CAPEX from 20% oversizing (extra panels): +500,000 €
- Additional production captured (avoiding curtailment losses): +100,000 €/year
- Payback: 5 years
But be careful: The DC/AC ratio has technical limits (typically 1.4). You can’t oversize infinitely.
6. Mitigation Strategies (Plant Already Operational)
If your plant already suffers curtailment, you have options to reduce losses:
Strategy 1: Hybridization with BESS
How it works:
- Instead of cutting production, you store in batteries
- You sell that energy during high price hours (without curtailment)
Economic example (25 MWp Plant with 6% curtailment):
Scenario without BESS:
- Curtailed production: 2,600 MWh/year
- Losses @ 30 €/MWh (typical curtailment hour price): 78,000 €/year
Scenario with BESS 3 MW / 6 MWh:
- Energy stored during curtailment: ~1,500 MWh/year (limited battery capacity)
- Energy sold during peak hours @ 60 €/MWh: 90,000 €
- Net gain vs without BESS: 90,000 - 45,000 (cost of that energy at pool price) = 45,000 €/year
- BESS CAPEX: 1.8 M€
- Payback: 40 years ❌ (not viable only for curtailment)
But:
- If you add arbitrage revenues (without curtailment): +60,000 €/year
- Total BESS revenues: 45,000 + 60,000 = 105,000 €/year
- Adjusted payback: 17 years ⚠️ (viability limit)
Conclusion: BESS helps mitigate curtailment, but is not profitable if curtailment is the only reason to install it. You need to justify it with arbitrage + grid services.
Strategy 2: Negotiate Compensation in PPA Contract
If you have a PPA, renegotiate the curtailment clause:
Standard clause (unfavorable):
“Technical curtailment ordered by REE is Generator’s risk. There will be no compensation.”
Negotiated clause (better):
“If technical curtailment exceeds 3% of annual production, Buyer will compensate Generator at 80% of PPA price for curtailed energy.”
Example:
- Curtailment 6% annually = 2,600 MWh
- Compensable: (6% - 3%) × 43,333 MWh = 1,300 MWh
- Compensation @ 80% × 40 €/MWh = 41,600 €/year
Reality: Off-takers usually resist assuming this risk. It’s easier to negotiate a slightly higher PPA price (e.g., 42 €/MWh instead of 40 €/MWh) in exchange for you assuming curtailment risk.
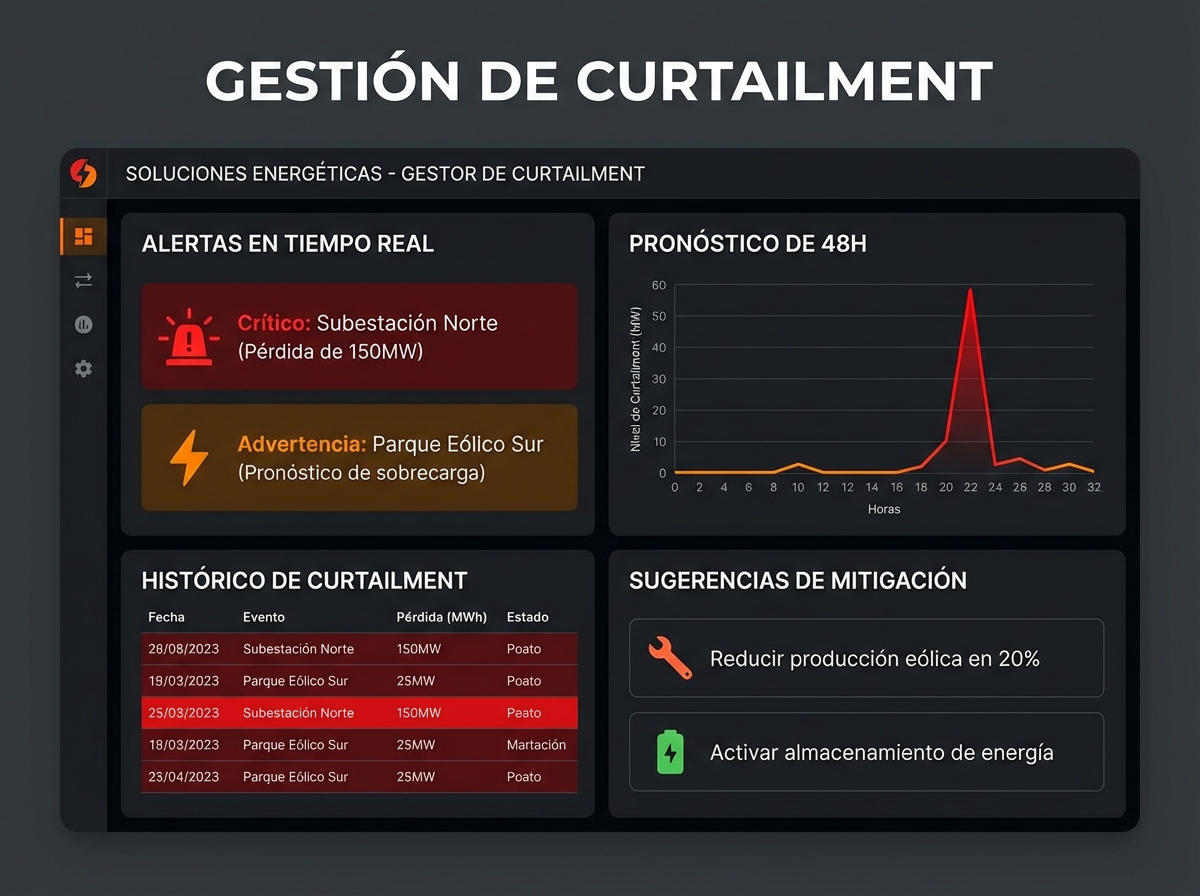
Strategy 3: Active Management with Forecasts
Use curtailment forecasts (REE publishes 24-48h in advance) to:
- Adjust intraday contracts: If you know they’ll cut your production tomorrow, don’t sell contracts you can’t fulfill
- Plan maintenance: Take advantage of scheduled curtailment periods for inspections
- Optimize BESS: Charge batteries anticipating curtailment
Tool: REE publishes “Technical restrictions forecast” on its ESIOS portal.
7. REE’s Role: Villain or Victim?
It’s easy to blame REE for curtailment, but the reality is nuanced:
What REE Does Well
- Transparency: Publishes technical restriction data in real time
- Planning: Has 7,000 M€ investment plan (2023-2030) for reinforcements
- Equity: Curtailment is distributed proportionally among plants at the same node
What REE Does Poorly (or Can’t Do)
- Slow execution: Reinforcements take 4-6 years from planning to operation
- Lack of compensation: Doesn’t pay generators for curtailed energy (because the law doesn’t require it)
- Miscoordinated permits: Approved thousands of MW of access without ensuring actual evacuability
Who Is Really to Blame?
Systemic problem: The Spanish regulatory framework allows approving connection permits without evacuability guarantee. Other countries (Germany, UK) require:
- More rigorous connection queue: Only approved if there’s physical capacity
- Mandatory compensation for curtailment > 2%
- Guarantee deposits from developers to discourage speculative projects
Spain is evolving toward this model, but slowly.
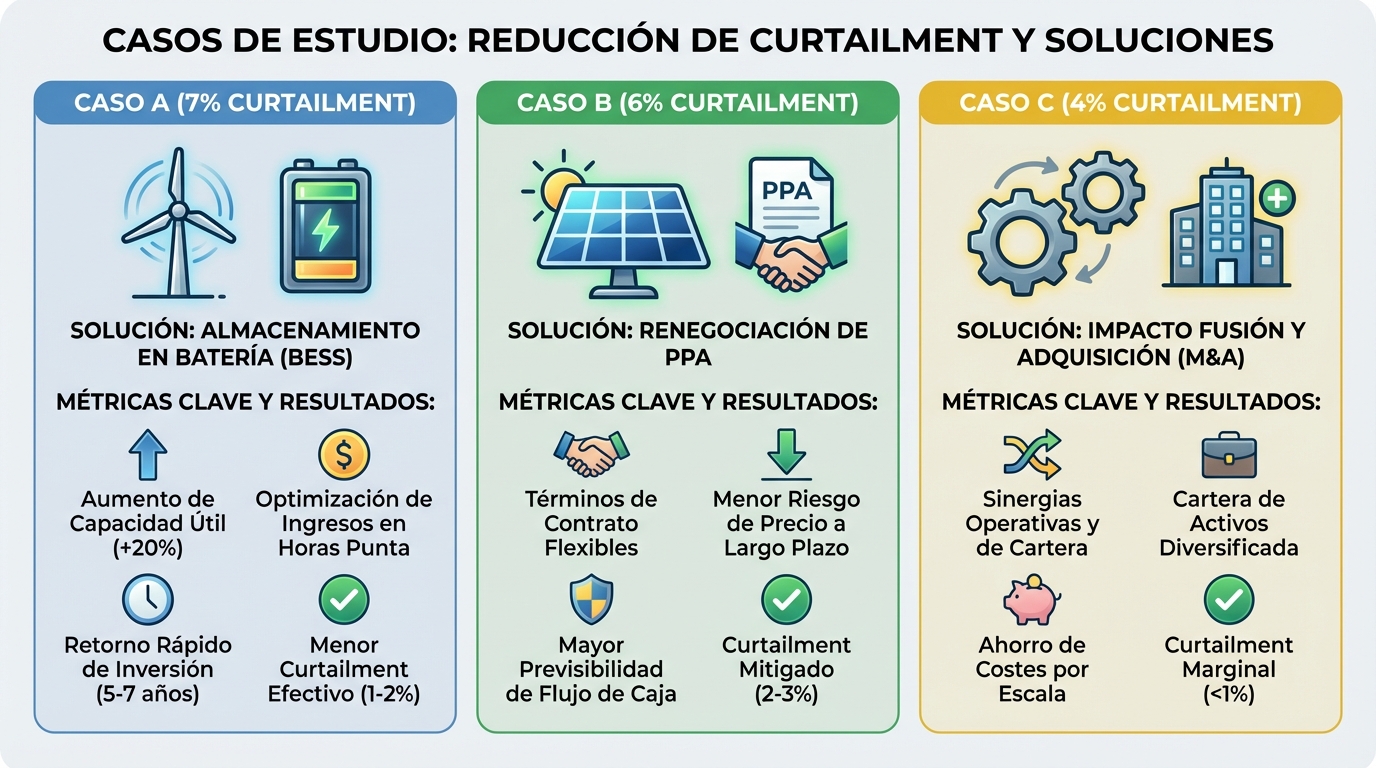
8. Real Cases: Testimonies from Affected Plants
Let’s analyze 3 real cases of plants with different curtailment levels:
Case A: 50 MWp Plant at Cedillo Node (Cáceres) - 7% Curtailment
Situation:
- Connected in 2022
- Average curtailment: 7% annually (3,000 MWh/year)
- Losses: 120,000 €/year @ 40 €/MWh
- Without compensation (direct pool contract)
Action taken:
- 2024: Installed BESS 4 MW / 8 MWh (3 M€ investment)
- Objective: Reduce effective curtailment from 7% to 4% + arbitrage revenues
Result (2025):
- Effective curtailment: 4.5% (recovered 2.5% by storing in battery)
- BESS arbitrage revenues: 80,000 €/year
- BESS payback: 20 years (marginal, but viable if batteries last 15+ years with replacement)
Case B: 30 MWp Plant at Bienvenida Node (Badajoz) - 6% Curtailment
Situation:
- Connected in 2023
- Curtailment: 6% annually
- With PPA at 38 €/MWh (no curtailment compensation clause)
Action taken:
- 2025: Renegotiated PPA with off-taker
- New clause: Price increased to 40 €/MWh in exchange for generator assuming curtailment risk
Result:
- Additional revenues from higher price: +80,000 €/year
- Curtailment losses: -70,000 €/year
- Net balance: +10,000 €/year (better than before)
Lesson: Sometimes, formally assuming curtailment risk allows you to negotiate a better price.
Case C: 20 MWp Plant at Torralba Node (Toledo) - 4% Curtailment
Situation:
- Connected in 2021 (early mover)
- Currently 4% curtailment (previously 2%)
- Sold to infrastructure fund in 2024
Impact on valuation:
- Initial valuation: 18 M€ (without considering curtailment)
- Due diligence revealed structural curtailment projected at 5% for 2025-2030
- Net present value of losses: 1.2 M€
- Final valuation: 16.8 M€
- Discount: -6.7%
Lesson: Curtailment reduces your plant’s value in M&A transactions. Sophisticated funds model it in their due diligence.
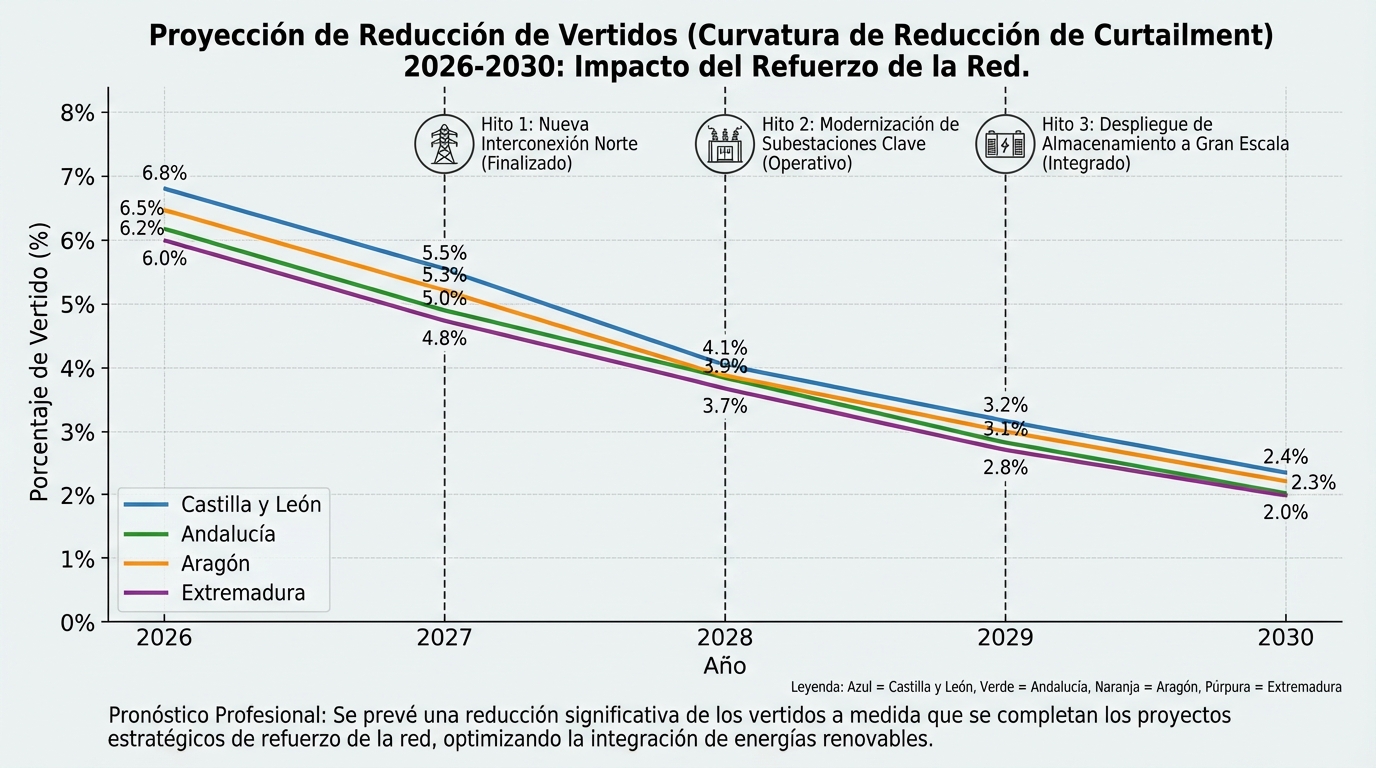
9. Outlook 2026-2030: Will the Situation Improve?
Good news: REE has ambitious grid reinforcement plans.
Planned Reinforcements (2026-2030)
| Project | Benefited Zone | Added Capacity | Timeline | Investment |
|---|---|---|---|---|
| New 400 kV line Extremadura-Portugal | Badajoz, Cáceres | +1,500 MW | 2027 | 200 M€ |
| Puertollano substation reinforcement | Ciudad Real | +500 MW | 2026 | 50 M€ |
| Albacete-Murcia meshing | Albacete, Murcia | +800 MW | 2028 | 120 M€ |
| Aragón South reinforcement | Teruel | +400 MW | 2027 | 70 M€ |
Projection: Average curtailment in critical zones should reduce from current 6-7% to 2-3% by 2028-2030.
But: Plants suffering curtailment today will continue suffering at least 2-3 more years before seeing improvements.
Possible Compensation Regulation
Proposal under discussion (2026):
- Compensate technical curtailment > 3% annually
- Payment at 80% of market price
- Financed by grid toll surcharge
Probability of approval: Medium-High (sector pressure is strong) If approved: Would enter into force in 2027
Impact: Losses for plants at critical nodes would reduce 30-40% if compensated.
10. Checklist: Are You at Risk of Curtailment?
Answer these questions to assess your risk:
For Plants in Development
- Does your node have an installed power / evacuation capacity ratio > 1.2?
- Are there more than 1,000 MW of solar already connected at your node?
- Is your connection point in Extremadura, Ciudad Real, Albacete, or Teruel?
- Does REE not have a grid reinforcement planned for your node before 2028?
If you answered YES to 3 or more: ⚠️ High curtailment risk (> 5% annually)
Recommended action:
- Request historical curtailment data from REE (it’s public)
- Model 5% curtailment scenario in your financial model
- Consider changing connection point if viable
For Operating Plants
- Have you had curtailment > 3% in the last year?
- Does your PPA not have a curtailment compensation clause?
- Don’t you have a battery system?
- Does REE not have a reinforcement planned for your area before 2027?
If you answered YES to 3 or more: ⚠️ You’re losing significant money
Recommended action:
- Calculate exact losses (curtailed production × sale price)
- Evaluate BESS if losses > 80,000 €/year
- Renegotiate PPA if possible (compensation clause or higher price)
11. PV Maps Tools for Curtailment Management
At PV Maps we offer specific tools for managing curtailment:
- Curtailment Risk Map: Visualize critical nodes before developing
- Curtailment Monitoring: Automatic tracking of REE orders and loss quantification
- BESS Simulator: Evaluate if installing a battery is profitable in your specific case
- Benchmarking: Compare your curtailment vs other plants in your region
Want to assess curtailment risk in your project? 👉 Access the curtailment risk map
Conclusion: Curtailment Is the Hidden Risk of the Solar Boom
Curtailment is probably the most underestimated risk in photovoltaic project development in Spain in 2026. Many financial models ignore it or model it at 1-2% (optimistic), when reality at critical nodes is 5-8%.
Keys to managing this risk:
- Exhaustive diligence in development phase: A saturated node can destroy your ROI
- Smart PPA negotiation: Ensure curtailment compensation or higher price
- BESS as partial mitigation: Helps, but is not the magic solution (long payback)
- Proactive monitoring: Use REE forecasts to adjust sales contracts
- Regulatory pressure: Join sector associations (UNEF) that pressure for compensation
The good news is that the situation will improve from 2027-2028 with planned grid reinforcements. But if your plant comes into operation in 2026, prepare for 2-4 years of structural curtailment.
Don’t let this risk surprise you. Model it, measure it, and mitigate it. Plants that ignore curtailment end up being worth 10-15% less when it comes time to sell them.