DC/AC Ratio in Photovoltaics: How to Optimize Your Inverter Design
Introduction
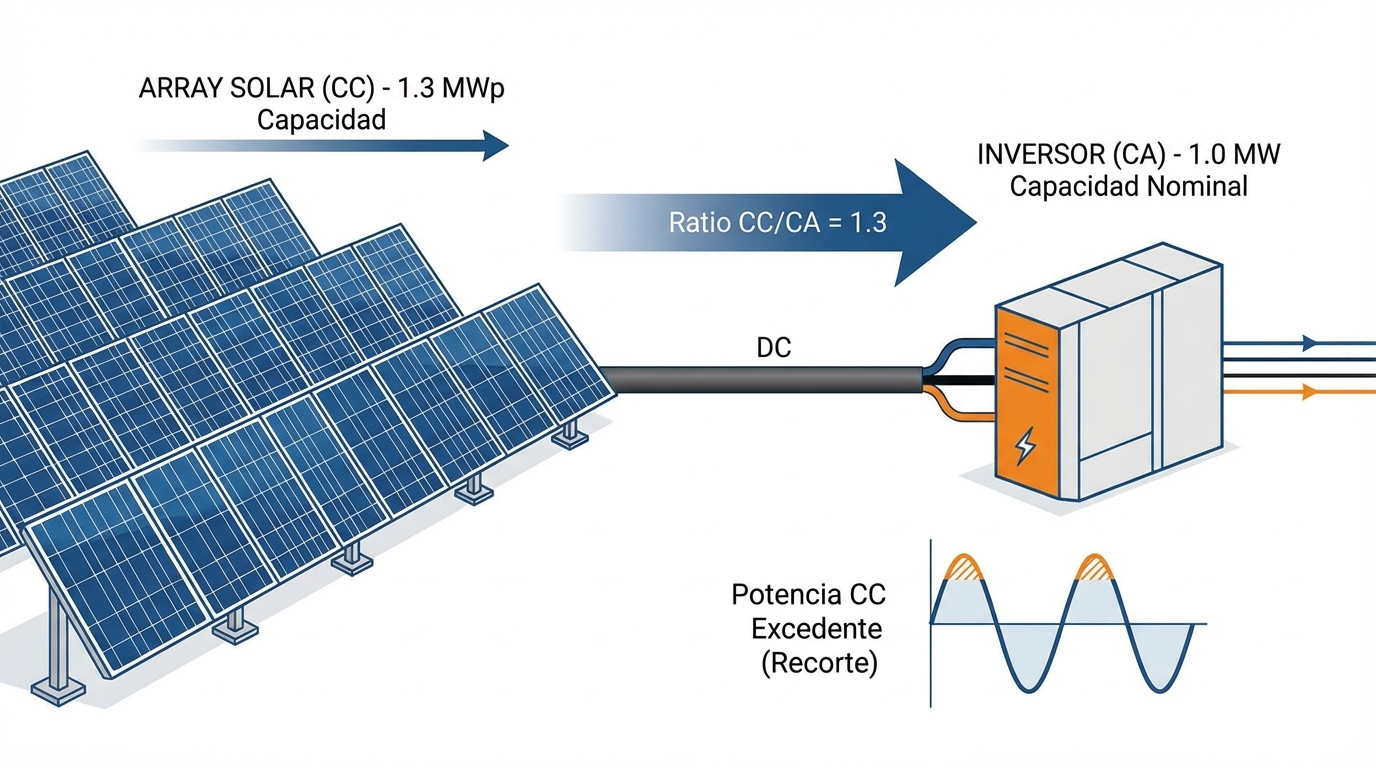
If you’re designing a photovoltaic plant, one of the most critical (and often misunderstood) decisions is: how much DC power from panels should I connect to each inverter? The answer isn’t simply “1 MWp of panels to 1 MW inverter.” In practice, modern plants in Spain operate with DC/AC ratios of 1.2 to 1.4, meaning you connect 20-40% more panel power than the inverter’s nominal capacity.
This technique, known as oversizing, allows you to capture more energy during low/medium irradiance hours (which are most of the day), at the cost of “losing” (clipping) some energy at maximum irradiance peaks. But, what’s the optimal ratio for your specific project?
The answer depends on multiple factors: local irradiance, market price, panel vs inverter cost, consumption profile (if self-consumption), and grid restrictions. In this article, we’ll break down the physics and economics behind the DC/AC ratio, analyze typical ranges in different areas of Spain, and present case studies with real data.
1. What is the DC/AC ratio?
Definition
Example:
- Installed panels: 12 MWp DC
- Inverter: 10 MW AC
- DC/AC Ratio = 12 / 10 = 1.2
Why oversize?
Panels rarely operate at maximum power (STC: 1000 W/m², 25°C). In real conditions:
| Condition | Typical Irradiance | Real Power (% of STC) |
|---|---|---|
| Dawn/Dusk | 100-300 W/m² | 10-30% |
| Morning/Afternoon | 400-700 W/m² | 40-70% |
| Noon (summer) | 900-1100 W/m² | 90-110% |
| Noon (winter) | 600-800 W/m² | 60-80% |
The inverter is underutilized 80% of the time if the ratio is 1.0. By increasing the ratio to 1.3, you better utilize the inverter’s capacity during low/medium irradiance hours.
2. Advantages and disadvantages of oversizing
Advantages
| Benefit | Impact |
|---|---|
| Higher annual production | +8-12% total energy (vs ratio 1.0) |
| Better utilization on cloudy days | Produces more in suboptimal conditions |
| Lower LCOE | More kWh per € invested |
| Lower cost per kWp DC | Save on inverters (expensive component) |
| Earlier start-up | Generates from lower irradiances |
Disadvantages
| Drawback | Impact |
|---|---|
| Clipping loss | Production loss at peaks (1-5% depending on ratio) |
| Thermal stress on inverter | Can reduce lifespan if poorly ventilated |
| Higher CAPEX in panels | Need more surface and structure |
| Power limitation | If PPA or grid access limits AC power |
The art is finding the optimal point where you maximize revenue without losing valuable energy to clipping.
3. What is clipping loss?
Definition
Clipping occurs when the DC power generated by panels exceeds the inverter’s AC capacity. The inverter “clips” the excess, limiting output to its maximum power.
Numerical example
10 MWp plant with 8 MW inverter (1.25 ratio)
| Time | Irradiance | DC Power Generated | Inverter AC Power | Clipping |
|---|---|---|---|---|
| 10:00 | 600 W/m² | 6.0 MW | 6.0 MW | 0 MW |
| 12:00 | 950 W/m² | 9.5 MW | 8.0 MW | 1.5 MW 🔴 |
| 14:00 | 900 W/m² | 9.0 MW | 8.0 MW | 1.0 MW 🔴 |
| 16:00 | 500 W/m² | 5.0 MW | 5.0 MW | 0 MW |
In this example, there’s clipping from 12:00 to 14:00. Over the year, this can represent 2-4% of lost energy.
How much clipping is acceptable?
| Annual Clipping Loss | Assessment | Typical in Ratio |
|---|---|---|
| < 2% | Optimal | 1.15 - 1.25 |
| 2-4% | Acceptable | 1.25 - 1.35 |
| 4-7% | Marginal | 1.35 - 1.45 |
| > 7% | Excessive | > 1.45 |
Rule of thumb: If clipping loss exceeds 3%, you’re leaving money on the table at market price peaks (noon).
4. Optimal ratio calculation
Variables to consider
- Local irradiance (GHI): Higher irradiance → lower optimal ratio
- Hourly price distribution: If price peak coincides with solar peak, avoid clipping
- Relative panel vs inverter cost: Cheap panels → favors high ratio
- Ambient temperature: Hot areas → panels operate below STC (allows higher ratio)
- Panel degradation: Ratio decreases over time (plan for 10-year view)
Simplified formula (for Spain)
Example: Seville
- GHI: 5.3 kWh/m²/day
- Price factor: 1.0 (spot market, no time preference)
- Optimal ratio ≈ 1.0 + 0.3 × (5/5.3) × 1.0 ≈ 1.28
Example: Galicia
- GHI: 3.8 kWh/m²/day
- Price factor: 1.0
- Optimal ratio ≈ 1.0 + 0.3 × (5/3.8) × 1.0 ≈ 1.39
Interpretation: In lower irradiance areas, you can afford higher ratios because you rarely reach peak power.
5. Typical ranges in Spain (2026)
By climate zone
| Zone | GHI (kWh/m²/year) | Typical DC/AC Ratio | Expected Clipping Loss |
|---|---|---|---|
| Andalusia | 1,900 - 2,000 | 1.20 - 1.30 | 2-3% |
| Extremadura | 1,850 - 1,950 | 1.25 - 1.32 | 2-4% |
| Castilla-La Mancha | 1,800 - 1,900 | 1.28 - 1.35 | 3-4% |
| Aragón | 1,700 - 1,800 | 1.30 - 1.38 | 3-5% |
| Galicia | 1,400 - 1,500 | 1.35 - 1.45 | 4-6% |
By project type
| Project Type | Typical Ratio | Justification |
|---|---|---|
| Utility-scale plants (> 10 MW) | 1.25 - 1.32 | Balance between production and inverter cost |
| Industrial self-consumption | 1.10 - 1.20 | Prioritizes not saturating during consumption hours |
| Plants with BESS | 1.35 - 1.45 | Battery absorbs clipping at peaks |
| Plants with 1-axis tracking | 1.15 - 1.25 | Tracker already optimizes capture |
| Fixed optimally oriented plants | 1.25 - 1.35 | Standard |
6. Real case studies
Case A: 50 MWp Plant in Badajoz (1.28 Ratio)
Configuration:
- Panels: 92,000 × 545 Wp = 50.14 MWp DC
- Inverters: 20 × 1.95 MW = 39 MW AC
- Ratio: 50.14 / 39 = 1.286
Year 1 results (2024):
- Gross DC production: 89.5 GWh
- Clipping loss: 2.1 GWh (2.3%)
- Net AC production: 87.4 GWh
- PR: 81.2%
Economic analysis:
- Additional energy vs ratio 1.0: +7.8 GWh/year
- Additional revenue: 7.8 GWh × €42/MWh = €327,600/year
- Additional cost in panels (vs ratio 1.0): €2.8M
- Oversizing payback: 8.5 years (very profitable)
Case B: 10 MWp Plant in Almería (1.22 Ratio)
Configuration:
- Panels: 18,400 × 550 Wp = 10.12 MWp DC
- Inverters: 4 × 2.07 MW = 8.28 MW AC
- Ratio: 10.12 / 8.28 = 1.222
Year 1 results (2025):
- Gross DC production: 19.1 GWh
- Clipping loss: 0.38 GWh (2.0%)
- Net AC production: 18.72 GWh
- PR: 82.8%
Why lower ratio in Almería:
- Very high irradiance (2,080 kWh/m²/year)
- In summer, frequently reaches power > 100% STC
- 1.22 ratio minimizes clipping while maximizing total production
Case C: 500 kWp Self-consumption in Madrid (1.12 Ratio)
Configuration:
- Panels: 896 × 560 Wp = 501.76 kWp DC
- Inverter: 450 kW AC
- Ratio: 501.76 / 450 = 1.115
Why low ratio:
- Industrial consumption: Demand peaks coincide with solar peaks
- Objective: avoid grid export (penalized by tariff)
- Low ratio ensures never exceeds instantaneous consumption capacity
Result: 0.3% clipping, 98% self-consumption
7. Impact of ratio on different inverter types
Central vs string inverters
| Inverter Type | Typical Ratio | Advantage | Disadvantage |
|---|---|---|---|
| Central (> 1 MW) | 1.25 - 1.35 | More economical, allows aggressive oversizing | If it fails, you lose entire field |
| String (< 100 kW) | 1.15 - 1.25 | Redundancy, independent MPPTs | More expensive, limits oversizing |
Inverters with multiple MPPTs
Modern inverters have 2-12 independent MPPTs (Maximum Power Point Trackers), which allows:
- Mixed orientations: East + West on same inverter
- Oversizing per MPPT: Each MPPT can have its own ratio (e.g., 1.3 on south-facing strings, 1.1 on east/west)
Advanced strategy: Connect more panels to MPPTs of strings with suboptimal orientation (east/west), as they’ll never reach maximum power simultaneously with south-facing strings.
8. DC/AC ratio and storage (BESS)
Strategy: Use battery to capture clipping
In plants with BESS, you can afford higher ratios (1.4-1.5) because:
- Battery absorbs peaks: Instead of losing energy to clipping, you store it
- Price arbitrage: Sell stored energy at higher price hours (evening/night)
Example: 10 MWp Plant + BESS 2 MW/4 MWh
Without BESS (1.25 ratio):
- Clipping: 2.5% (437 MWh/year lost)
- Production: 17,500 MWh/year
With BESS (1.40 ratio):
- Clipping without BESS would be: 5.2% (1,014 MWh/year)
- BESS captures: 800 MWh/year of clipping (79%)
- Residual clipping: 1.1% (214 MWh/year)
- Total production: 19,536 MWh + 800 MWh charged in battery = 20,336 MWh equivalent
Additional revenue from arbitrage:
- 800 MWh sold at peak price (€55/MWh) vs noon price (€30/MWh)
- Differential: €25/MWh × 800 = €20,000/year extra
9. Simulation tools
Recommended software
| Tool | Cost | DC/AC Functionality |
|---|---|---|
| PVsyst | €1,500/license | Detailed clipping simulation, multiple scenarios |
| SAM (NREL) | Free | Integrated financial analysis |
| HOMER | €600/year | Optimization with BESS |
| Excel + PVGIS | Free | Simplified calculation (acceptable for preliminary studies) |
Key parameters to simulate
- Range of ratios: Simulate 1.10 / 1.20 / 1.30 / 1.40
- Hourly irradiance data: Use TMY (Typical Meteorological Year)
- Price curves: Integrate last year’s hourly OMIE price
- Degradation: Project to 25 years with 0.5%/year
Target output: NPV (Net Present Value) curve vs DC/AC ratio
10. Common mistakes when choosing the ratio
Mistake #1: Copying ratios from other countries
The optimal ratio in Germany (1.35-1.50) doesn’t apply in Andalusia. Germany has low irradiance (1,200 kWh/m²/year) vs Andalusia (2,000 kWh/m²/year).
Mistake #2: Not considering grid restrictions
If your connection point limits AC power to 10 MW, it doesn’t help to design with 12 MW inverter. Your maximum ratio will be limited by this restriction.
Mistake #3: Optimizing only for total annual production
The goal isn’t to maximize kWh, but to maximize revenue. If your PPA pays more at noon peak hours, minimize clipping even if you produce fewer total kWh.
Mistake #4: Not planning for degradation
With 0.5%/year degradation, your effective ratio falls:
- Year 1: 1.30
- Year 10: 1.24
- Year 20: 1.17
Strategy: Some designers start with ratio 1.35-1.40 knowing it will drop to ~1.25 in year 10 (long-term optimal point).
Mistake #5: Ignoring operating temperature
In very hot areas (Seville, Córdoba), panels operate at 60-70°C in summer, reducing their real power 15-20% vs STC (25°C). This allows higher ratios without excessive clipping.
11. Conclusion: There’s no “perfect” ratio
The optimal DC/AC ratio depends on your project’s specific context. There’s no universal answer, but these principles guide the decision:
General rules:
- High irradiance (Andalusia, Extremadura): Ratio 1.20 - 1.30
- Medium irradiance (Castilla, Aragón): Ratio 1.25 - 1.35
- Low irradiance (Galicia, Asturias): Ratio 1.35 - 1.45
- With BESS: +0.10 - 0.15 to base ratio
- With 1-axis tracking: -0.05 - 0.10 to base ratio
Optimization process:
- Simulate your project with PVsyst or SAM (test ratios 1.15 / 1.25 / 1.35)
- Calculate NPV for each scenario (production × price - CAPEX - OPEX)
- Choose the ratio that maximizes NPV, not the one that maximizes production
The DC/AC ratio is one of the few design variables that can improve your IRR by 0.5-1 percentage point without increasing risk. Dedicate time to optimize it.
Want to compare your design with similar plants? Access our plant benchmark by zone