Solar Portfolio Management: Why Excel Is Limiting Your Asset Profitability
Introduction
If you’re an Asset Manager or CFO of a renewable portfolio, you probably know this feeling: it’s Monday morning, you have to send the performance report to investors, and you’re praying that the file “Master_Portfolio_VFinal_V2.xlsx” doesn’t get corrupted when you open it.
Excel is a wonderful tool. It’s the canvas where almost all financial models in the photovoltaic sector are born. However, what works for developing a project or managing a single plant becomes an operational trap when you try to scale.
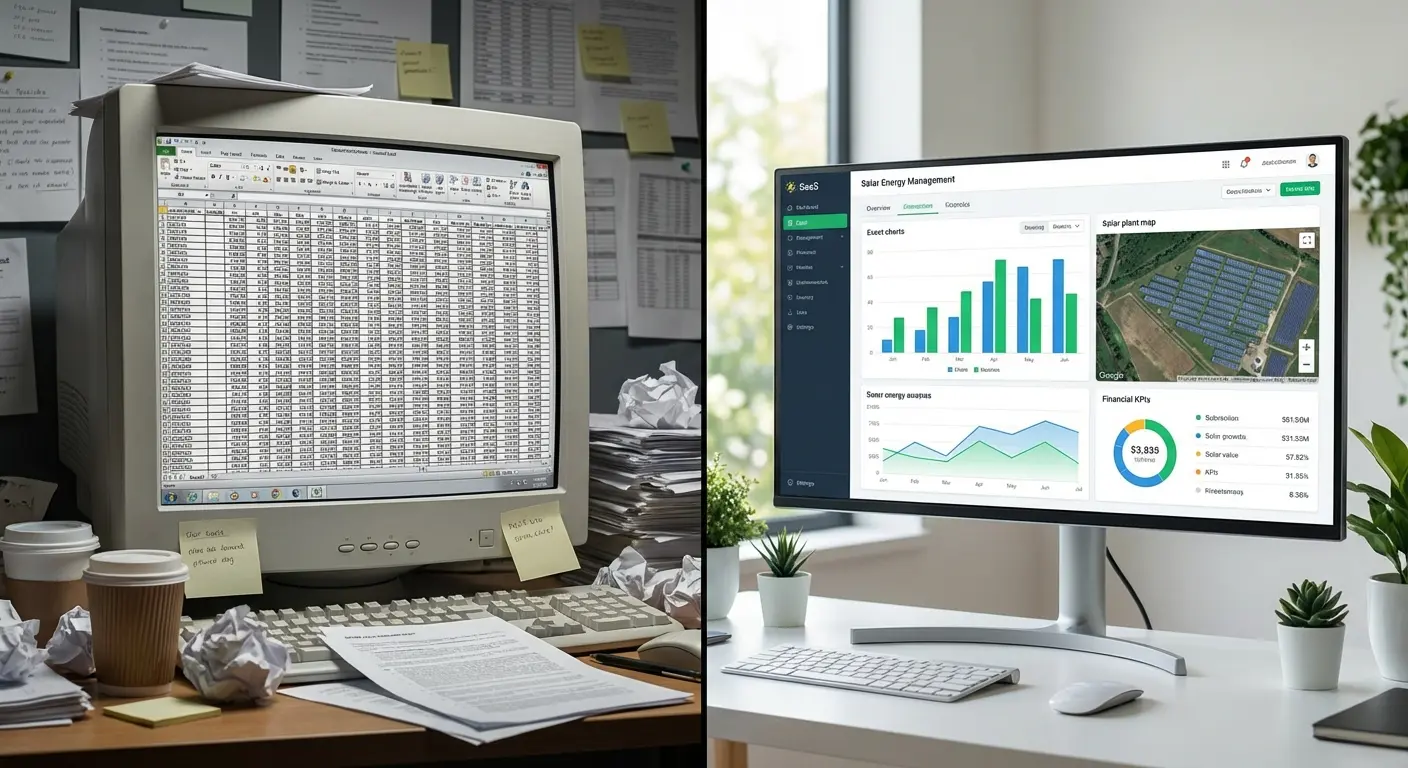
When you manage multiple assets, static monitoring (Excel) versus dynamic monitoring (SaaS) is not just a matter of convenience; it’s a matter of money. In this article, we analyze why relying exclusively on spreadsheets is limiting the financial visibility of your plants and how the transition to specialized software like PV Maps can unlock hidden profitability.
Section 1: The Invisible Cost of “Copy-Paste”
The first problem with Excel is not technical, it’s human. Solar asset management requires massive data ingestion: hourly load curves, utility bills, irradiation data, and market prices.

If your workflow involves downloading a CSV from the SCADA portal, another from OMIE, and another from the bank, and then manually unifying them in a spreadsheet, you’re exposed to two serious risks:
- Human Error: Just move a column or make a mistake in a formula and the Performance Ratio (PR) calculation is wrong. Making O&M decisions based on incorrect data costs money.
- Opportunity Cost: Every hour your engineering team spends “cleaning data” and “fixing macros” is an hour they don’t spend analyzing why inverter 3 at the Badajoz plant has lower-than-expected performance.
Management software automates data ingestion. Your team stops being a “data processor” and becomes an “asset analyst.”
Section 2: The Blind Spot of Market Prices
This is where Excel fails spectacularly in the current market. 10 years ago, with regulated tariffs (FIT), knowing production (kWh) was enough to know revenues. Today, in a marginalist market with high volatility and cannibalization, 1 MWh produced at 14:00 is not worth the same as 1 MWh produced at 19:00.

Excel is static. It doesn’t connect to the internet to download real-time hourly prices from OMIE or ESIOS. This forces you to work with averages or past data.
The consequence: You may be meeting your production targets (kWh) but failing in your revenue targets (€), and your Excel won’t warn you until you close the month. A SaaS tool like PV Maps crosses your actual generation curve with market prices hour by hour automatically, showing you your real daily Capture Price.
Section 3: The Nightmare of Data Integrity and Versions
“Who has the latest version of the financial model?”
This question is repeated daily in asset management companies. When information lives in local files:
- Data is fragmented into silos (the finance department has one Excel, the technical department has another).
- History is lost. Comparing this January’s performance with that of 3 years ago requires opening old files and praying that the formats match.
- Security is null. A file sent by email is a vulnerable asset.

A centralized cloud database eliminates the concept of “versions.” Everyone looks at the same data, updated by the second.
Section 4: From Reactive to Proactive Management
Excel’s biggest limitation is that it’s a “Post-Mortem” tool. It tells you what happened last month when it’s too late to fix it.
If a plant is suffering losses from curtailment (technical restrictions) or if a tracker is stuck, Excel won’t send you an alert. A specialized SaaS will. Modern solar asset management is about detecting the anomaly today to correct it tomorrow, not reporting it at the end of the month.
Section 5: Centralize Your Portfolio with PV Maps
You don’t need to abandon Excel for everything; it’s still great for ad-hoc models. But for recurring, operational, and financial management, you need robustness.
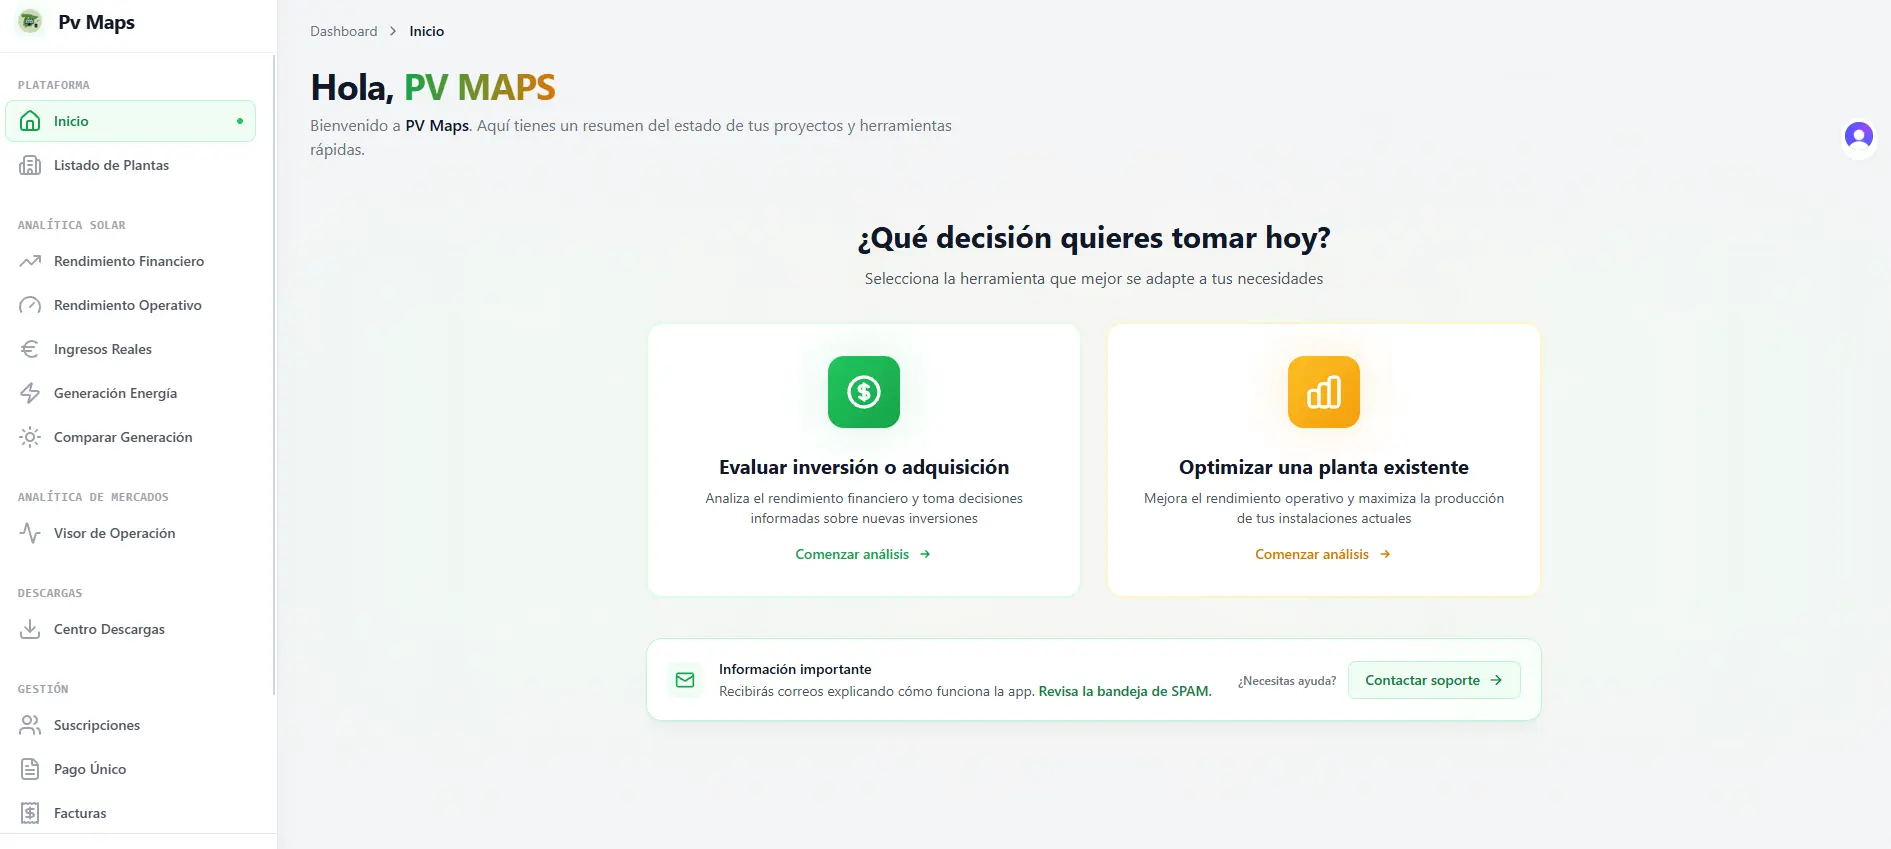
PV Maps is designed to eliminate manual noise:
- Unified Inventory: All your plants, large or small, on one map.
- Automatic Financial Analytics: Real revenues, market prices, and performance comparisons without touching a single formula.
- Document Management: Invoices and contracts linked to each asset.
Conclusion
The transition from Excel to SaaS is not an expense, it’s an investment in scalability. If you manage more than 5 MWp, the cost of man-hours dedicated to maintaining spreadsheets far exceeds the cost of a software license.
Let machines process the data and allow your team to provide real value.
Ready to stop fighting with macros? Try PV Maps for free today and connect your first plant in minutes.