Real-Time OMIE Price: How to Use It to Optimize Solar Energy Sales
Introduction
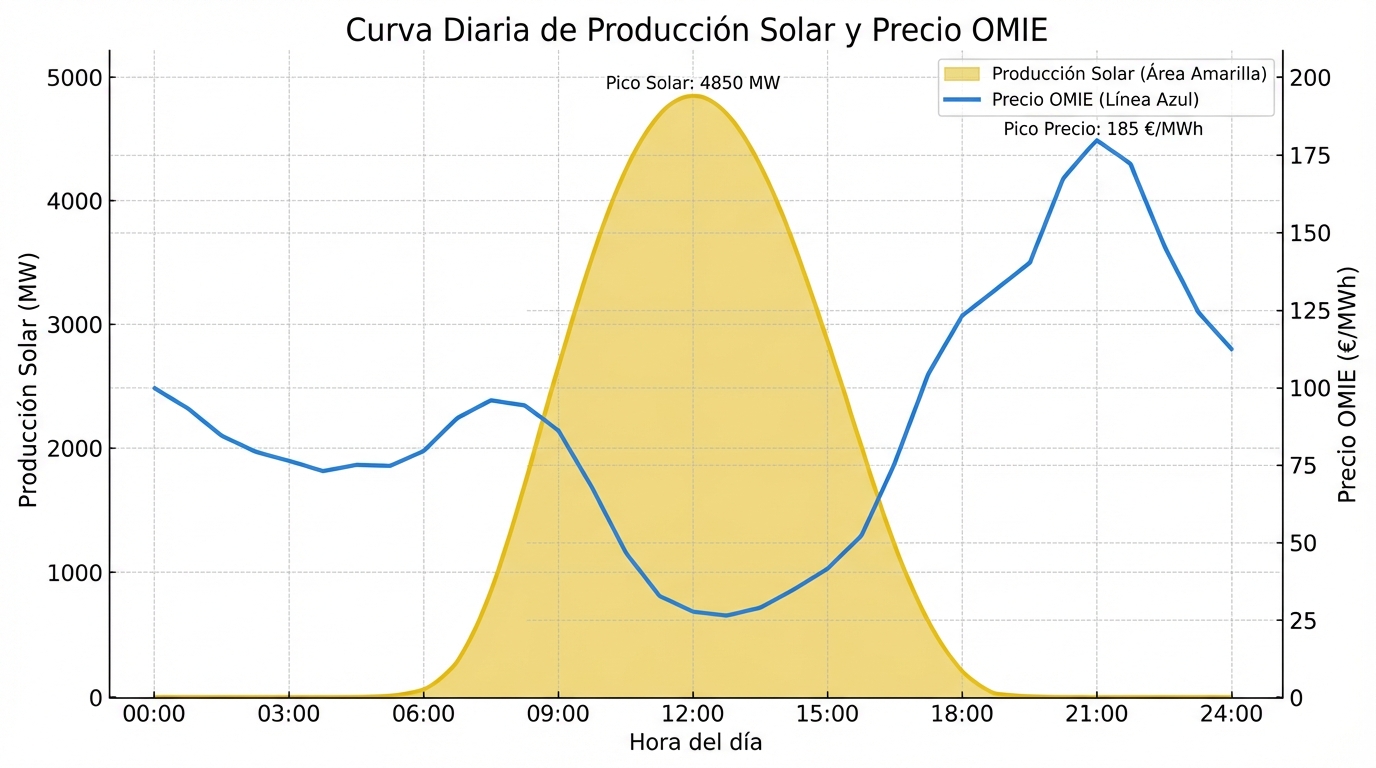
It’s 1:00 PM on a Sunday in April. Your 20 MWp photovoltaic plant is producing at full capacity: 18 MW. The price in the electricity market (OMIE) at that moment is 12 €/MWh. Three hours later, at 4:00 PM, production remains high but the price has risen to 48 €/MWh. And at 8:00 PM, when your production drops to 2 MW, the price reaches 85 €/MWh.
If you sell your energy at the average daily price (45 €/MWh), you’ll earn 45 € per MWh. But if you had a battery system (BESS) and stored energy at 1:00 PM to sell it at 8:00 PM, you could earn 85 €/MWh for that energy. Difference: 40 €/MWh arbitrage.
The problem is that most photovoltaic plant managers don’t understand how the OMIE market works or don’t have tools to make these decisions in real time. Result: they leave money on the table, day after day.
In this article, we’ll explain how the Spanish electricity market (OMIE) works, the differences between selling in the pool vs spot market, strategies to optimize income using hourly price curves, and the tools you need to manage all this from your phone while having breakfast.
1. What is OMIE and How Does the Spanish Electricity Market Work?
OMIE (Iberian Energy Market Operator) is the entity that manages the daily electricity market in Spain and Portugal. It’s where generators (like your solar plant) and buyers (retailers, industries) negotiate the price of electricity hour by hour.
Structure of the Spanish Electricity Market
The Spanish electricity market has several “submarkets”:
| Market | Time Horizon | Purpose |
|---|---|---|
| Day-Ahead Market | D-1 (closes at 12:00 the day before) | Electricity purchase/sale for the next day, hour by hour |
| Intraday Market | From D-1 until 1h before delivery | Last-minute adjustments (changes in production/demand forecast) |
| Balancing Services Market | Real time | Frequency regulation and system balance (operated by REE) |
| Forward Market (Futures) | Months/years ahead | Long-term price hedging (financial PPAs are settled here) |
For a photovoltaic plant without a PPA, the relevant market is the Day-Ahead Market (OMIE pool).
How is the Price Set in OMIE?
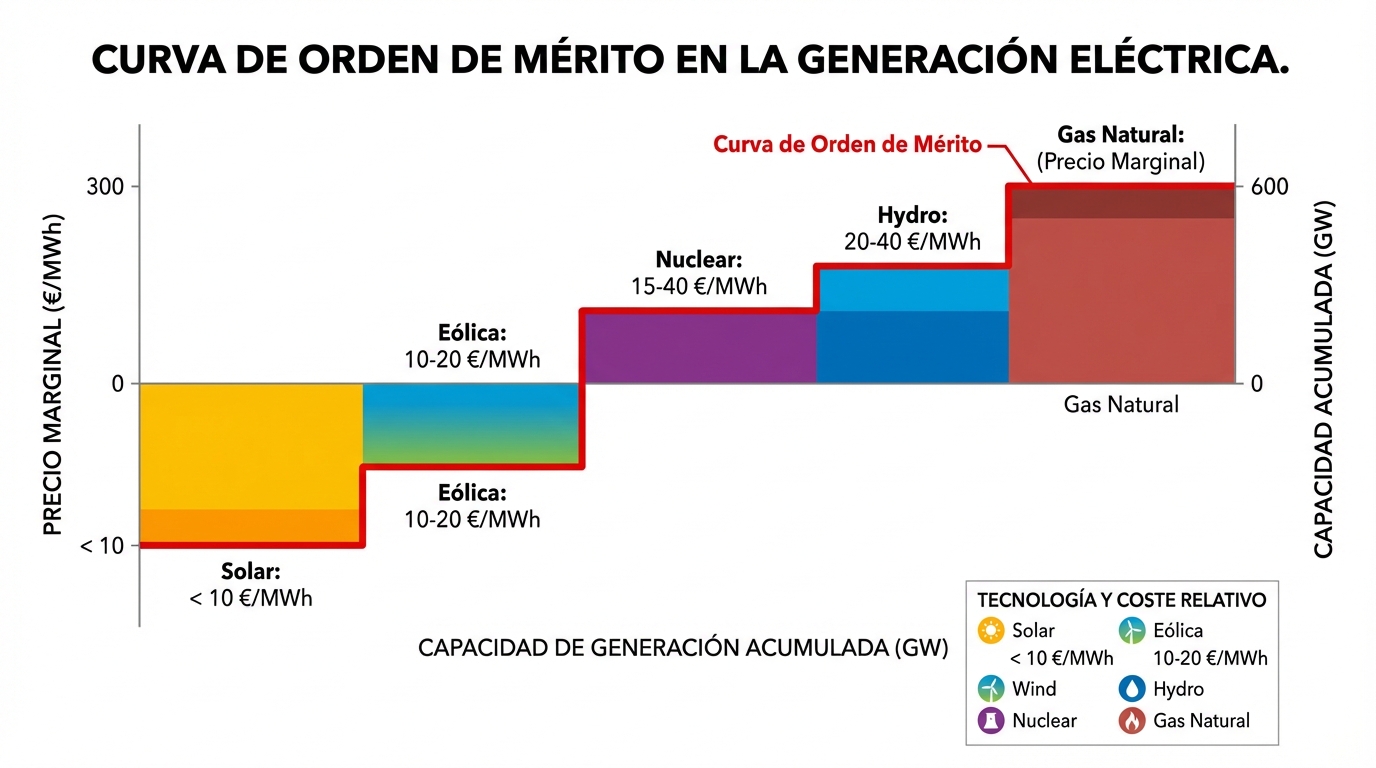
The day-ahead market works with a marginal matching system:
- Generators (solar, wind, nuclear, gas plants) offer their energy at a minimum price they’re willing to sell at
- Buyers (retailers, industries) bid for the energy they need
- OMIE matches all offers and demands hour by hour
- The final price (marginal price) is that of the last power plant that enters to cover demand
Simplified example (hour 14:00):
- Total demand in Spain: 30,000 MW
- Offers ordered by price:
- Solar: 10,000 MW at 0 €/MWh (marginal cost ~0)
- Wind: 8,000 MW at 0 €/MWh
- Nuclear: 7,000 MW at 10 €/MWh
- Hydro: 3,000 MW at 25 €/MWh
- Combined cycle (gas): 2,000 MW at 55 €/MWh ← Last plant needed
Final price for everyone: 55 €/MWh (all plants get paid the same, regardless of their offer)
Key implication: Solar plants offer at 0 €/MWh (because the sun is free), but receive the marginal price of the system, generally determined by gas plants.
2. Capture Price: Why Solar Plants Get Paid Less Than Average
Although the average daily price in OMIE might be 50 €/MWh, solar plants usually receive less due to a phenomenon called solar cannibalization effect.
The Problem: All Solar Plants Produce at the Same Time
- Hour 14:00 (full solar production): 15,000 MW of solar in the system
- Effect: Displace gas plants → marginal price drops to 25-30 €/MWh
- Hour 20:00 (no sun): 0 MW of solar in the system
- Effect: Gas plants enter → marginal price rises to 70-80 €/MWh
Result: Solar plants sell when the price is low and don’t sell when the price is high.
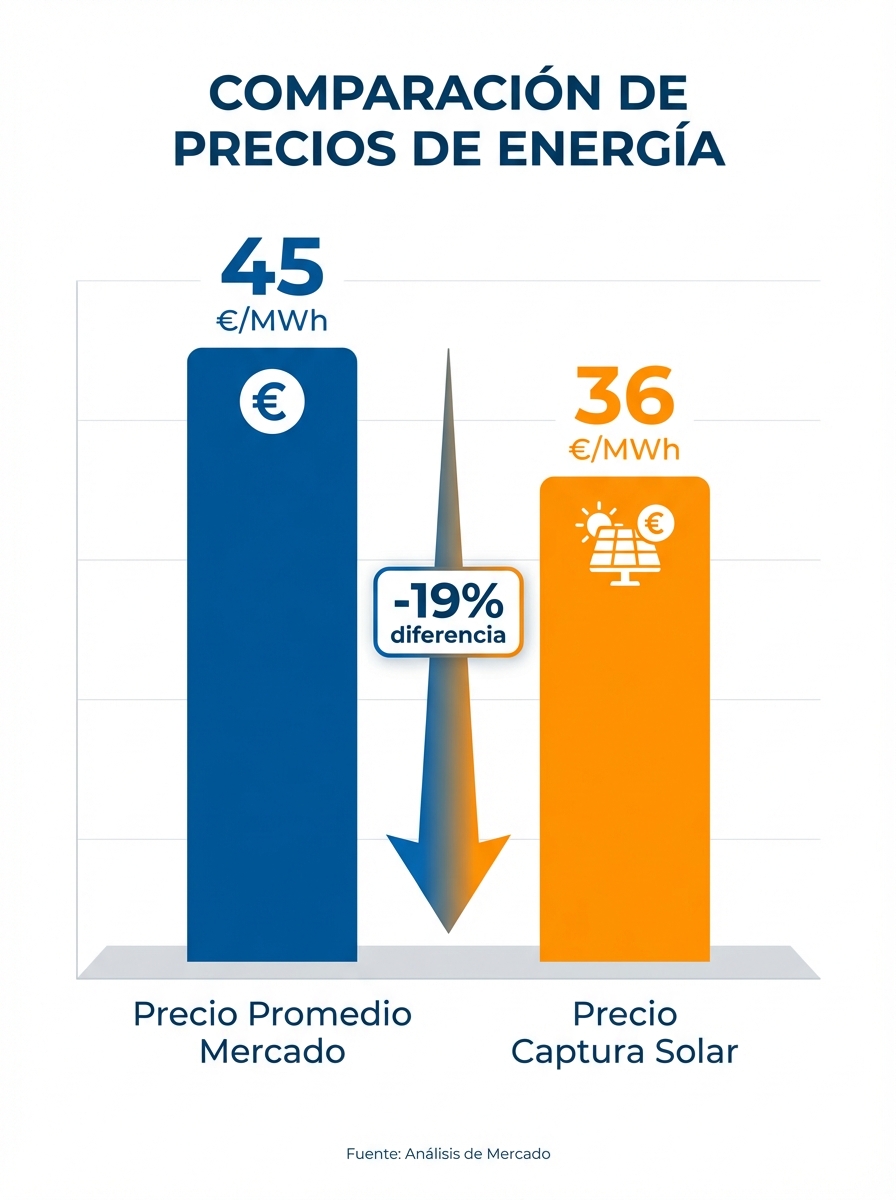
Capture Price
The capture price is the weighted average price that a solar plant receives, considering the hours when it produces:
Real example (plant in Seville, typical summer day):
| Hour | Production (MWh) | OMIE Price (€/MWh) | Revenue (€) |
|---|---|---|---|
| 08:00 | 5 | 45 | 225 |
| 10:00 | 15 | 38 | 570 |
| 12:00 | 20 | 28 | 560 |
| 14:00 | 22 | 25 | 550 |
| 16:00 | 18 | 32 | 576 |
| 18:00 | 8 | 55 | 440 |
| 20:00 | 2 | 75 | 150 |
| Total | 90 | Daily avg: 42 | 3,071 |
Average daily price: 42 €/MWh Solar capture price: 3,071 / 90 = 34.1 €/MWh
Difference (cannibalization factor): -19% compared to average daily price
This is critical: When modeling your plant’s revenue, don’t use the average annual OMIE price. Use the solar capture price, which is typically 10-20% lower.
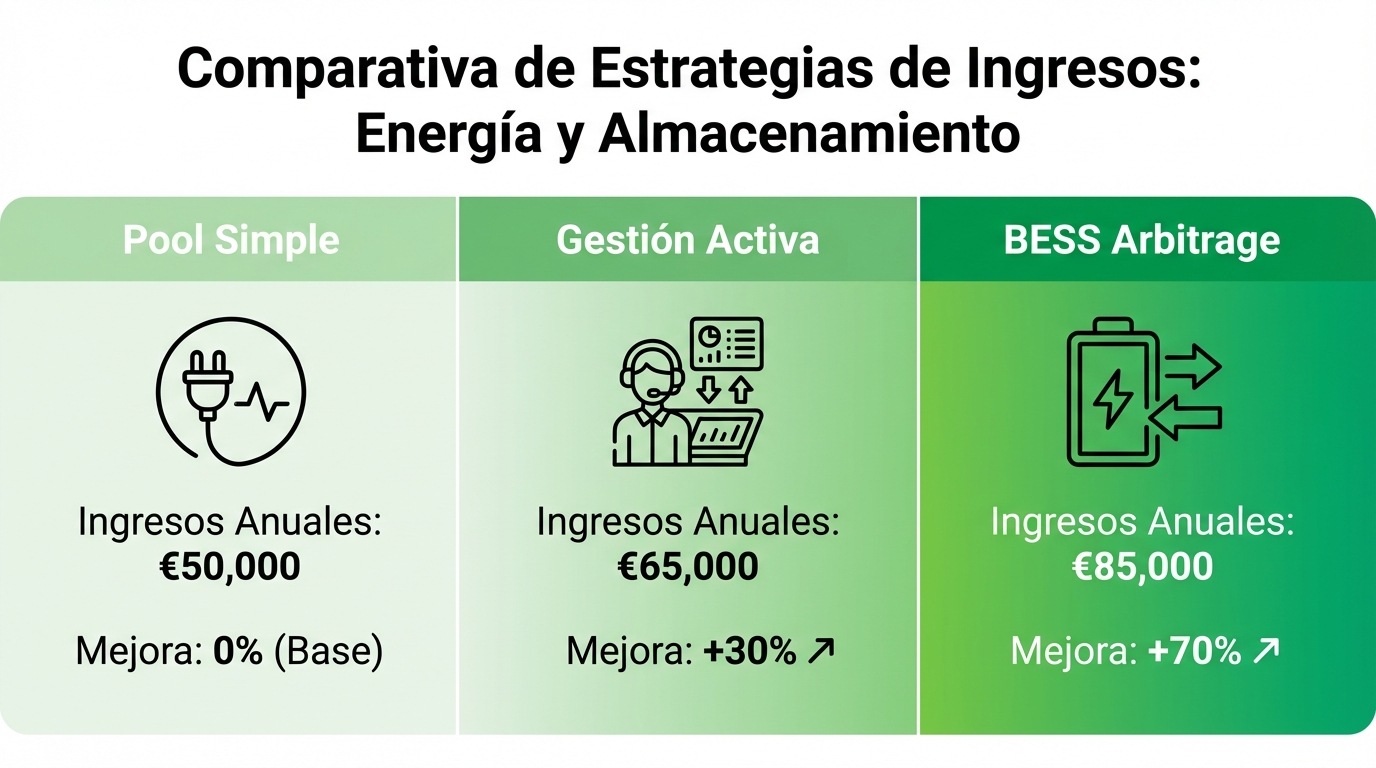
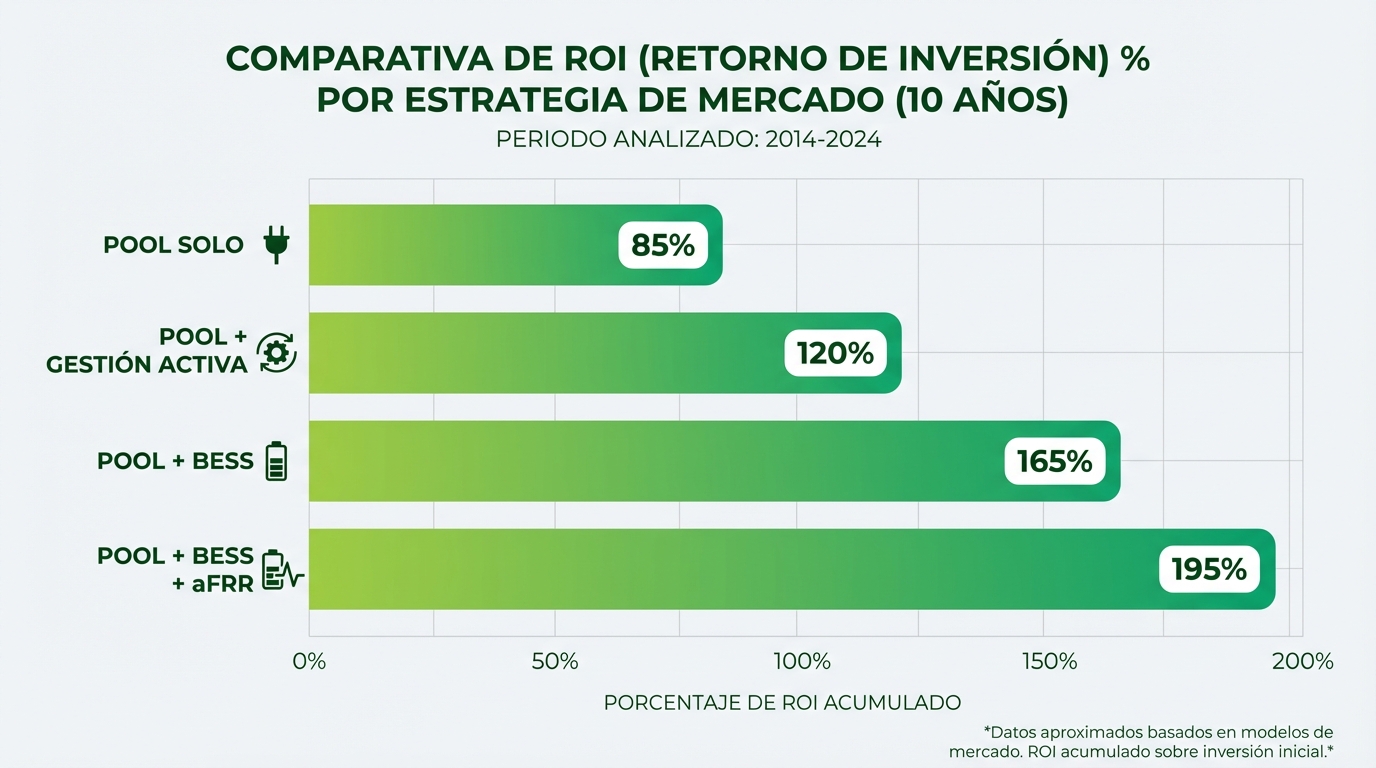
3. Sales Strategies: Pool vs Spot Market vs BESS Arbitrage
You have three main options to sell your energy:
Option 1: Pool Sale (No Active Management)
How it works:
- Your retailer sells all your production at the hourly marginal price of OMIE
- You receive the average capture price
- You make no decisions: everything is automatic
Advantages:
- ✅ Total simplicity
- ✅ No management cost
Disadvantages:
- ❌ Capture price 10-20% lower than market average
- ❌ You don’t take advantage of arbitrage opportunities
- ❌ 100% exposed to hourly volatility
Ideal for: Small plants (< 5 MWp) or asset managers without trading capacity
Option 2: Active Management in Intraday Market
How it works:
- You monitor production forecasts and OMIE prices in real time
- If you see that the price at 8:00 PM will be very high, you sell forward contracts in the intraday market
- If you see that your production will be lower than expected, you adjust your positions to avoid deviations
Advantages:
- ✅ You can improve capture price 3-8%
- ✅ Reduce penalties for deviations
Disadvantages:
- ❌ Requires trading platform (cost: 1,000-3,000 €/month)
- ❌ You need a team with market knowledge
- ❌ Risk of error in forecasts
Ideal for: Plants > 20 MWp with professional asset manager
Option 3: BESS Arbitrage (With Batteries)
How it works:
- You store energy during low price hours (12:00-16:00)
- You discharge during high price hours (19:00-22:00)
- You capture the spread between low and high price
Arbitrage example:
- Buy/store energy at 25 €/MWh (14:00)
- Sell at 70 €/MWh (20:00)
- Gross spread: 45 €/MWh
- Battery round-trip efficiency: 85% → net spread = 38 €/MWh
- Battery degradation: -2 €/MWh → final net spread: 36 €/MWh
For 2 MW / 4 MWh BESS system:
- Arbitrage cycles: 250 days/year
- Arbitraged energy: 4 MWh × 250 = 1,000 MWh/year
- Additional revenue: 1,000 × 36 = 36,000 €/year
Advantages:
- ✅ Improves plant ROI 15-30%
- ✅ Reduces curtailment (you store instead of cutting production)
- ✅ You can participate in regulation services (additional revenue)
Disadvantages:
- ❌ Additional CAPEX: 300-400 €/kWh (1.2-1.6 M€ for 4 MWh)
- ❌ Battery degradation: 2-3% capacity/year
- ❌ Requires sophisticated optimization algorithm
Ideal for: Plants > 30 MWp in areas with high price spreads (> 40 €/MWh between valley and peak)
4. Hourly Price Curves: Seasonal Patterns and Opportunities
OMIE prices are not random. They follow predictable patterns that you can leverage:
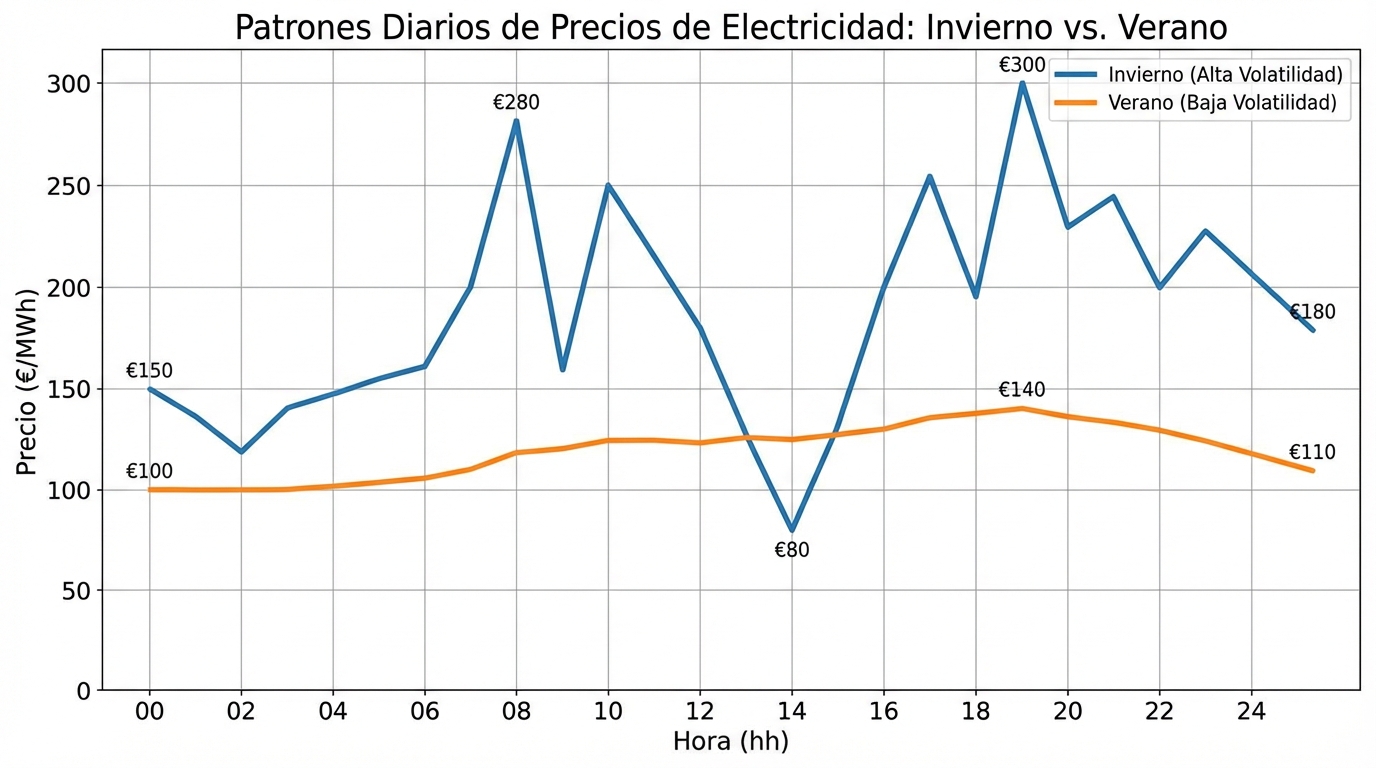
Typical Daily Pattern
Winter (high demand, little sun):
- Valley (03:00-07:00): 35-45 €/MWh
- Morning ramp (08:00-11:00): 50-60 €/MWh
- Midday (12:00-16:00): 45-55 €/MWh (solar reduces price)
- Evening peak (18:00-22:00): 70-90 €/MWh ← Maximum opportunity
- Night valley (23:00-02:00): 40-50 €/MWh
Summer (moderate demand, lots of sun):
- Valley (03:00-07:00): 20-30 €/MWh
- Midday (12:00-16:00): 15-25 €/MWh (solar saturation) ← Possible negative price
- Evening peak (19:00-21:00): 50-65 €/MWh (less peak than winter)
Key lesson: The value of BESS is higher in winter (spreads of 40-50 €/MWh) than in summer (spreads of 20-30 €/MWh).
Negative Prices: What to Do?
On very windy and sunny days, the OMIE price can become negative (you read that right: they pay you to consume electricity).
Real example (May 2, 2025, 14:00):
- OMIE price: -5 €/MWh
- Your plant produces 20 MWh
- Revenue: 20 × (-5) = -100 € (you lose money)
Strategies for negative prices:
- If you DON’T have BESS: Accept the loss (it’s marginal, 1-3 days/year)
- If you have BESS: Charge batteries for free (or they pay you to charge them) and sell during peak hours
- If you have flexible curtailment: Negotiate with your retailer to cut production without penalty
Frequency of negative prices in Spain (2025):
- Northern Spain (Galicia, Asturias): 5-10 days/year
- Center/South (Castilla, Extremadura): 1-3 days/year
5. BESS Optimization: When to Charge and When to Discharge
If you have a battery system, you need a decision algorithm to maximize revenue. It’s not enough to “charge when the price is low and discharge when it’s high” because:
- The battery has limited capacity (e.g., 4 MWh)
- The battery has round-trip efficiency (85-90%)
- Each cycle degrades the battery (implicit cost)
- There are multiple price peaks in a day
Basic Optimization Algorithm
Step 1: Price Forecast
- Download hourly price forecasts for the next 24-48h (available in ESIOS API)
- Identify lowest valley and highest peak
Step 2: Charge Decision
- If current price < (expected peak price - 30 €/MWh) / efficiency → CHARGE
- Example: Current price 25 €/MWh, expected peak 70 €/MWh, efficiency 85%
- Threshold: (70 - 30) / 0.85 = 47 €/MWh
- 25 < 47 → YES, charge
Step 3: Discharge Decision
- If current price > expected valley + 30 €/MWh → DISCHARGE
- Example: Current price 65 €/MWh, valley was 25 €/MWh
- Threshold: 25 + 30 = 55 €/MWh
- 65 > 55 → YES, discharge
Step 4: State of Charge (SOC) Management
- Don’t discharge below 20% SOC (preserve useful life)
- Don’t charge above 90% SOC (maximize available cycles)
- Reserve 10-20% capacity for regulation services (if participating in aFRR)
Real Case: Typical Winter Day Optimization
20 MWp plant + 2 MW / 4 MWh BESS
| Hour | PV Production (MWh) | Price (€/MWh) | BESS Decision | Grid Energy (MWh) | Revenue (€) |
|---|---|---|---|---|---|
| 08:00 | 5 | 50 | Sell all | 5 | 250 |
| 10:00 | 15 | 45 | Sell all | 15 | 675 |
| 12:00 | 20 | 30 | Charge 2 MWh | 18 | 540 |
| 14:00 | 22 | 25 | Charge 2 MWh | 20 | 500 |
| 16:00 | 18 | 35 | Sell all | 18 | 630 |
| 18:00 | 8 | 60 | Sell all | 8 | 480 |
| 20:00 | 0 | 75 | Discharge 3.4 MWh* | 3.4 | 255 |
| 21:00 | 0 | 70 | - | 0 | 0 |
| Total | 88 | Average: 47 | 4 MWh charged | 87.4 | 3,330 |
*3.4 MWh = 4 MWh charged × 85% efficiency
Without BESS:
- Revenue: 88 MWh × 36 €/MWh (capture price) = 3,168 €
With BESS:
- Revenue: 3,330 €
- Improvement: 162 € (5.1% on that day)
- Annualized (250 days): 162 × 250 = 40,500 €/year additional

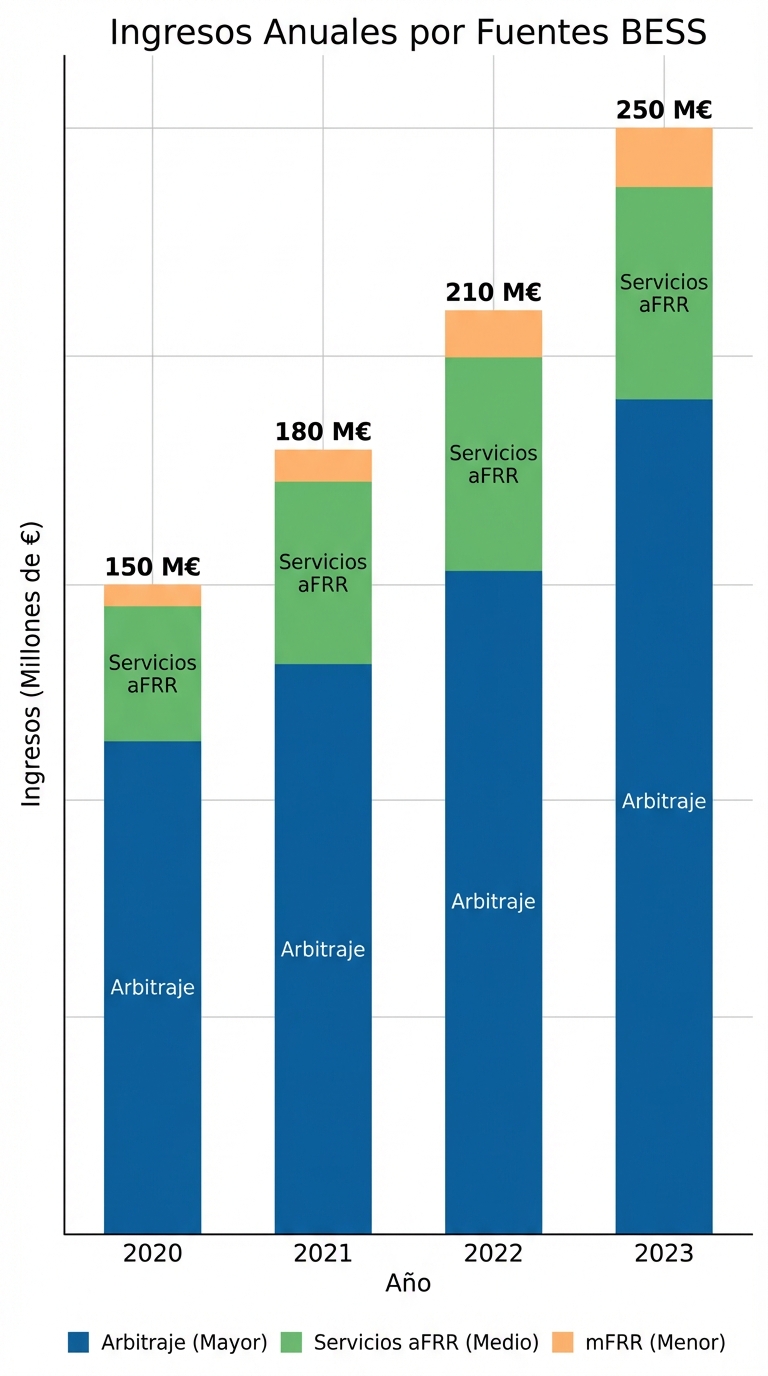
6. Regulation Services: Complementary Revenue
Beyond arbitrage, batteries can participate in balancing service markets (frequency regulation):
aFRR (Automatic Secondary Reserve)
- What it is: Your battery automatically responds to signals from REE to raise/lower power and maintain system frequency at 50 Hz
- Remuneration: Paid for availability (being ready to regulate), not just regulated energy
- Typical revenue: 50-150 €/MW/day (variable depending on system demand)
For 2 MW BESS:
- Average revenue: 80 €/MW/day × 2 MW × 300 days = 48,000 €/year
- But: You reserve part of your capacity for regulation → you reduce capacity for arbitrage
Optimization:
- Valley hours (low price volatility): Allocate 80% of battery to aFRR
- Peak hours (high volatility): Allocate 80% to arbitrage, 20% to aFRR
mFRR (Manual Tertiary Reserve)
- What it is: Manual activation for longer imbalances (15-60 min)
- Remuneration: Lower than aFRR, more sporadic
- Typical revenue: 10,000-20,000 €/MW/year
Conclusion: Participating in aFRR can increase BESS revenue by an additional 30-50% beyond arbitrage, but requires REE certification and compatible control systems.
7. Tools for Real-Time Monitoring
To manage all this, you need tools that give you real-time visibility of prices and production:
7.1 ESIOS API (Red Eléctrica de España)
ESIOS is the official source of data from the Spanish electricity market. It offers a free API with:
- Hourly OMIE prices (real time and D+1 forecasts)
- System demand
- Generation by technology (solar, wind, hydro, etc.)
- Balancing service prices
Key endpoint:
https://api.esios.ree.es/indicators/1001?start_date=2026-01-20&end_date=2026-01-21Indicator 1001: Hourly marginal price of the day-ahead market (€/MWh)
Example usage in Python:
import requests

url = "https://api.esios.ree.es/indicators/1001"
headers = {"Authorization": "Token YOUR_API_KEY"}
params = {"start_date": "2026-01-20T00:00:00", "end_date": "2026-01-21T23:59:59"}

response = requests.get(url, headers=headers, params=params)
data = response.json()

for entry in data['indicator']['values']:
    hora = entry['datetime']
    precio = entry['value']
print(f"{hora}: {precio} €/MWh")Advantage: Official data, free, updated every hour
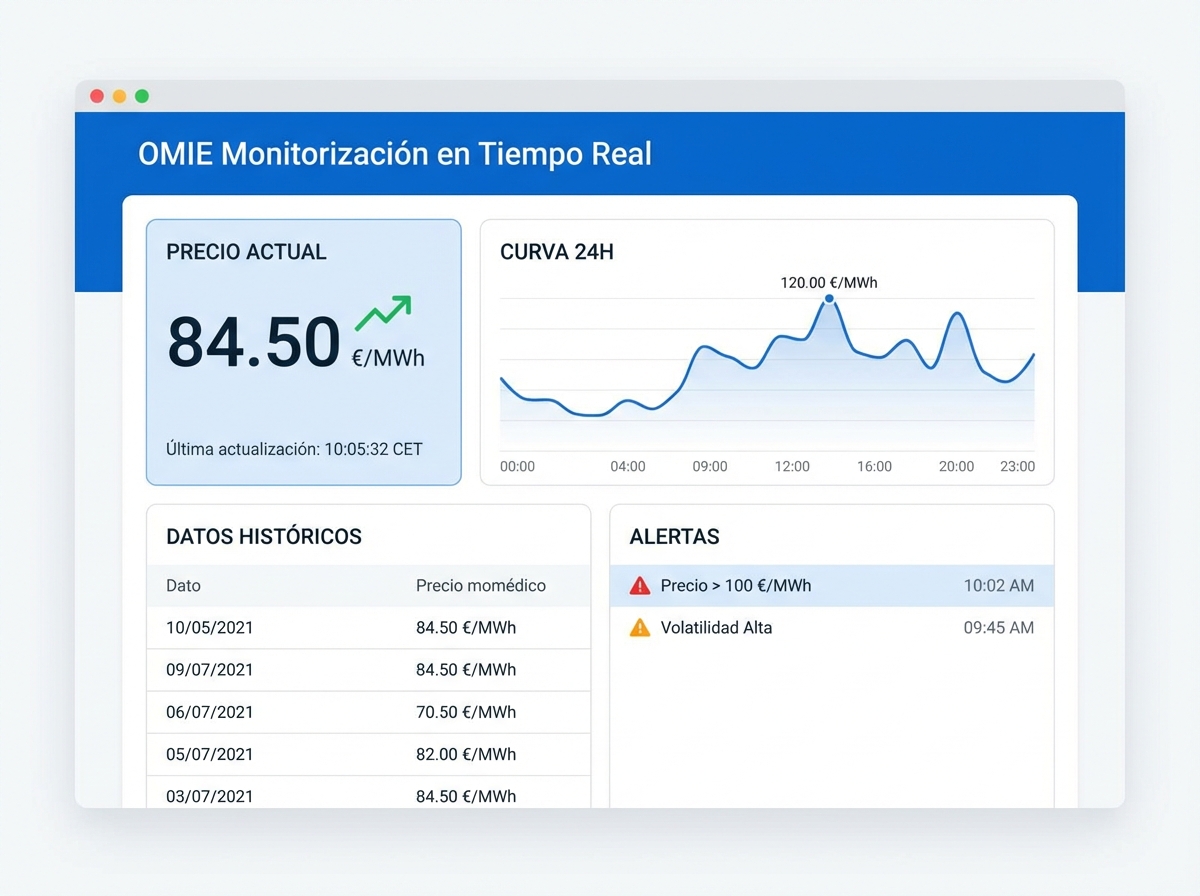
7.2 PV Maps Platform
At PV Maps, we offer a Market Optimization module that:
- Integrates ESIOS automatically: You see hourly prices on your dashboard
- Calculates capture price of your plant in real time
- Simulates BESS strategies: “How much would I earn with arbitrage this month?”
- Price alerts: Notification when price > 70 €/MWh or < 20 €/MWh
- Benchmarking: Compare your capture price with other solar plants in your region
Want to monitor OMIE prices from your phone? 👉 Access the market optimization module
7.3 Mobile Market Apps
Several free/paid apps for price monitoring:
- REE App (official): Real-time generation and demand data
- PVPC App: Hourly prices (although focused on regulated tariffs)
- Energy Pool: Professional trading platform (paid, for large portfolios)
8. Real Cases: Optimization Gains
We analyzed 3 real plants and their market strategy:
Case A: 50 MWp Plant Without BESS (Pool Only)
Location: Badajoz Annual production: 87,500 MWh Average OMIE price 2025: 42 €/MWh Real capture price: 36 €/MWh (-14% vs average) Annual revenue: 87,500 × 36 = 3.15 M€
Improvement potential with active intraday management: +3% → 3.24 M€ (+90,000 €)
Case B: 30 MWp Plant + 3 MW / 6 MWh BESS (Arbitrage)
Location: Toledo Annual production: 52,500 MWh Capture price (without BESS): 35 €/MWh Base PV revenue: 52,500 × 35 = 1.84 M€
BESS arbitrage revenue:
- Cycles/year: 280
- Arbitraged energy: 6 MWh × 280 × 0.85 (efficiency) = 1,428 MWh
- Average spread: 38 €/MWh
- BESS revenue: 1,428 × 38 = 54,264 €
Total revenue: 1.84 M€ + 54,264 € = 1.89 M€ Improvement: +3%
Case C: 80 MWp Plant + 5 MW / 10 MWh BESS (Arbitrage + aFRR)
Location: Seville Annual production: 140,000 MWh Base PV revenue: 140,000 × 36 = 5.04 M€
BESS revenue:
- Arbitrage (70% of time): 60,000 €/year
- aFRR (30% of time): 45,000 €/year
- Total BESS: 105,000 €/year
Total revenue: 5.04 M€ + 105,000 € = 5.15 M€ Improvement: +2.1%
BESS Payback (investment 3 M€): 3,000,000 / 105,000 = 28.6 years (without considering degradation)
Conclusion: BESS improves revenue 2-3%, but with high CAPEX, the payback is long. It only makes sense for plants > 50 MWp with consistent price spreads > 40 €/MWh.
9. Checklist: Should You Invest in BESS?
Answer these questions:
| Question | Your Answer | Points |
|---|---|---|
| Is your plant > 30 MWp? | Yes / No | Yes = +2, No = 0 |
| Is the valley-peak price spread in your area > 40 €/MWh? | Yes / No | Yes = +3, No = 0 |
| Do you have curtailment > 5% annually? | Yes / No | Yes = +3, No = 0 |
| Can you participate in aFRR? | Yes / No | Yes = +2, No = 0 |
| Do you have trading/active management team? | Yes / No | Yes = +2, No = -1 |
Result:
- > 8 points: BESS is highly recommended
- 5-8 points: Analyze in detail, could be profitable
- < 5 points: Probably not worth it (for now)
Conclusion: The OMIE Market is Your Ally if You Know How to Use It
The Spanish electricity market is complex, but predictable if you have the right data. Solar plants that only sell to the pool without active management are leaving 5-10% of potential revenue on the table.
Key actions:
- Monitor your capture price: If it’s < 85% of the average OMIE price, you’re losing value
- Evaluate active management: Even without BESS, adjusting positions in the intraday market can add 50,000-100,000 €/year
- BESS only if it makes economic sense: It’s not the magic solution for all plants; do the numbers first
- Use professional tools: Don’t manage this in Excel; you need real-time alerts and automation
The future of the Spanish electricity market is heading towards greater volatility (more renewables = more variability). Those who know how to navigate these waters will win. Those who continue selling passively to the pool will see their margins compressed year after year.
Want to optimize your market revenue? Contact us for a personalized analysis.