
Solar Plant Secondary Market: How to Value and Sell Photovoltaic Assets in Spain
Introduction
The secondary market for photovoltaic assets in Spain has experienced explosive growth since 2020. If in 2015-2018 only €200-300M annually closed in operational plant transactions, in 2025 volume exceeded €3,500M, with more than 4 GW of capacity changing hands.
Why this boom? Several factors converge:
- Market maturity: Thousands of plants with > 5 years of operational history (reliable data for valuation)
- Infrastructure funds: International capital seeks low-risk assets with 7-10% returns
- Professionalized developers: “Build-to-sell” business model (build and sell at COD)
- Refinancing pressure: Plants financed in 2018-2020 with expensive debt seek to refinance or sell
For an asset manager, understanding how these transactions are valued and negotiated is critical whether you’re a seller (maximize price) or buyer (avoid overpaying). In this article, we’ll break down standard valuation multiples, factors that add or subtract value, the typical M&A process, and 2025-2026 price trends.
1. Fundamentals of photovoltaic asset valuation
Valuation methods
| Method | Description | Primary Use |
|---|---|---|
| DCF (Discounted Cash Flow) | Projection of discounted future cash flows | Technical valuation (banks, funds) |
| EBITDA Multiple | Enterprise Value / EBITDA | Quick market comparison |
| €/MWp installed | Enterprise Value / Installed power | Benchmark by technology/zone |
| Revenue multiple | Enterprise Value / Annual revenue | Less used (doesn’t reflect profitability) |
In practice, deals are negotiated in EBITDA multiples, but validated with DCF.
Enterprise Value (EV) formula
Example:
- Share purchase price (equity): €15M
- Existing debt: €8M
- Cash on balance: €0.5M
- EV = 15 + 8 - 0.5 = €22.5M
Important: Transactions are negotiated in EV terms (buyer assumes debt).
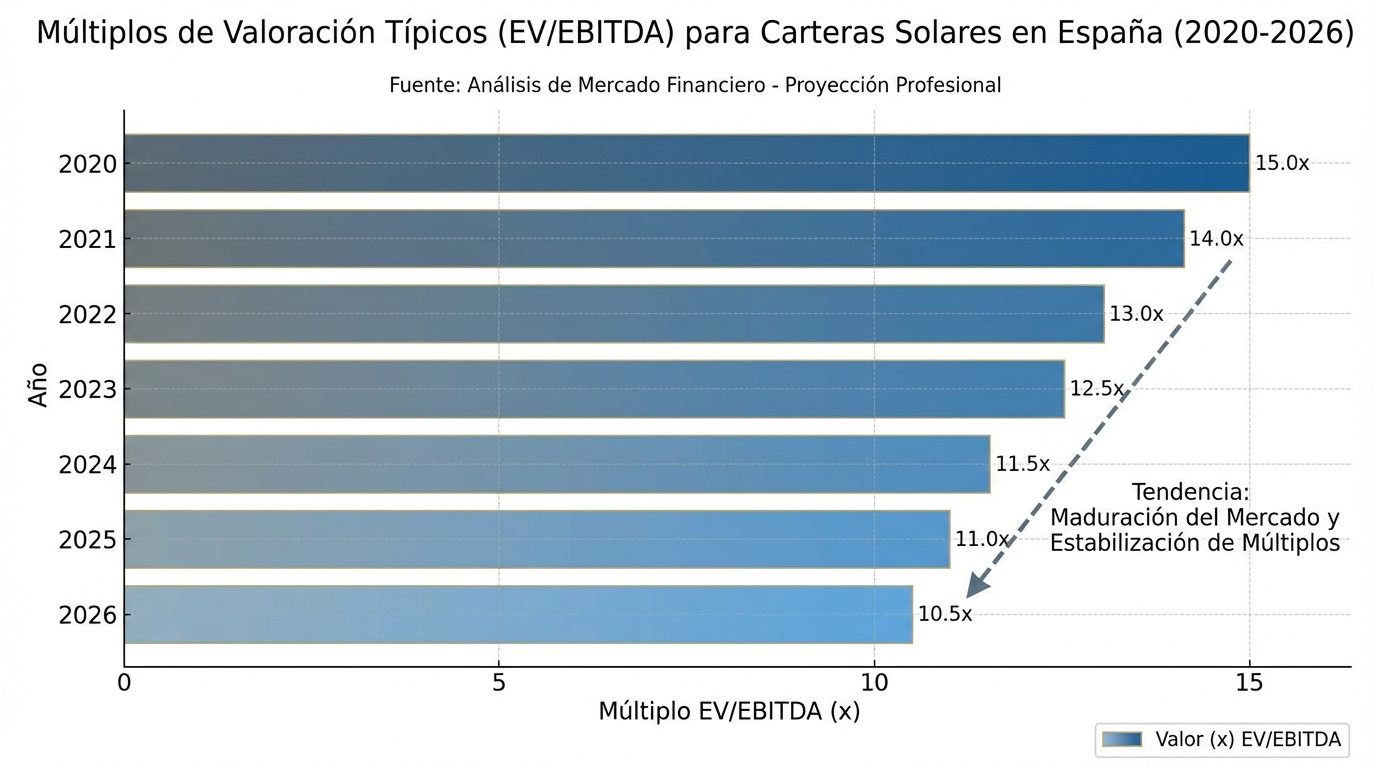
2. EBITDA multiples in Spain (2025-2026)
Range by asset type
| Asset Type | EBITDA Multiple (EV/EBITDA) | Comment |
|---|---|---|
| Merchant (no PPA) | 6.0 - 8.0x | Exposure to market volatility |
| Short-term PPA (< 5 years) | 7.0 - 9.0x | Limited stability |
| Medium-term PPA (5-10 years) | 8.5 - 11.0x | Market standard |
| Long-term PPA (> 10 years) | 10.0 - 13.0x | Premium for visibility |
| PPA with investment grade off-taker | 11.0 - 14.0x | Maximum value (minimal counterparty risk) |
2025-2026 Trend: Multiples have compressed slightly vs 2023-2024 (when they touched 12-15x) due to:
- Greater asset supply
- Rising interest rates (higher cost of capital)
- Competition among sellers
Factors that modify the multiple
Positive factors (+1 to +3x):
| Factor | Impact on Multiple |
|---|---|
| PPA > 10 years with BBB+ off-taker | +2.0 - 3.0x |
| Plant < 3 years (modern technology) | +0.5 - 1.0x |
| Performance Ratio > 82% (historical) | +0.5 - 1.0x |
| Location in high irradiance zone (Andalusia) | +0.3 - 0.5x |
| O&M contract with Tier 1 manufacturer | +0.3 - 0.5x |
| Low curtailment (< 1% historical) | +0.5 - 0.8x |
Negative factors (-1 to -3x):
| Factor | Impact on Multiple |
|---|---|
| PPA expiration in < 2 years | -1.5 - 2.0x |
| Land contract < 15 years remaining | -1.0 - 2.0x |
| Chronic curtailment (> 5% annual) | -1.5 - 2.5x |
| Equipment out of warranty (> 10 years) | -0.8 - 1.2x |
| Performance Ratio < 75% | -1.5 - 3.0x |
| Pending litigation (permits, connection) | -2.0 - 4.0x |
3. Valuation by €/MWp: Geographic benchmark
Typical 2025-2026 prices
| Zone | €/MWp (EV) | Range | Typical Production (kWh/kWp) |
|---|---|---|---|
| Andalusia | 950,000 - 1,100,000 | High | 1,750 - 1,850 |
| Extremadura | 900,000 - 1,050,000 | Medium-High | 1,700 - 1,800 |
| Castilla-La Mancha | 850,000 - 1,000,000 | Medium | 1,650 - 1,750 |
| Aragón | 800,000 - 950,000 | Medium | 1,550 - 1,650 |
| Galicia | 650,000 - 800,000 | Low | 1,300 - 1,400 |
Note: Prices assume plant with 8-10 year PPA, 3-5 years operation, PR > 80%.
Calculation example
25 MWp Plant in Seville:
- Benchmark: €1,000,000/MWp
- Estimated EV: €25M
Validation with EBITDA:
- Annual production: 43,750 MWh (1,750 kWh/kWp)
- Revenue (PPA €40/MWh): €1,750,000
- OPEX: €200,000 (€8/kWp)
- EBITDA: €1,550,000
- EV / EBITDA: €25M / €1.55M = 16.1x
Interpretation: 16x multiple is high (implies > 10 years remaining PPA or very aggressive buyer).
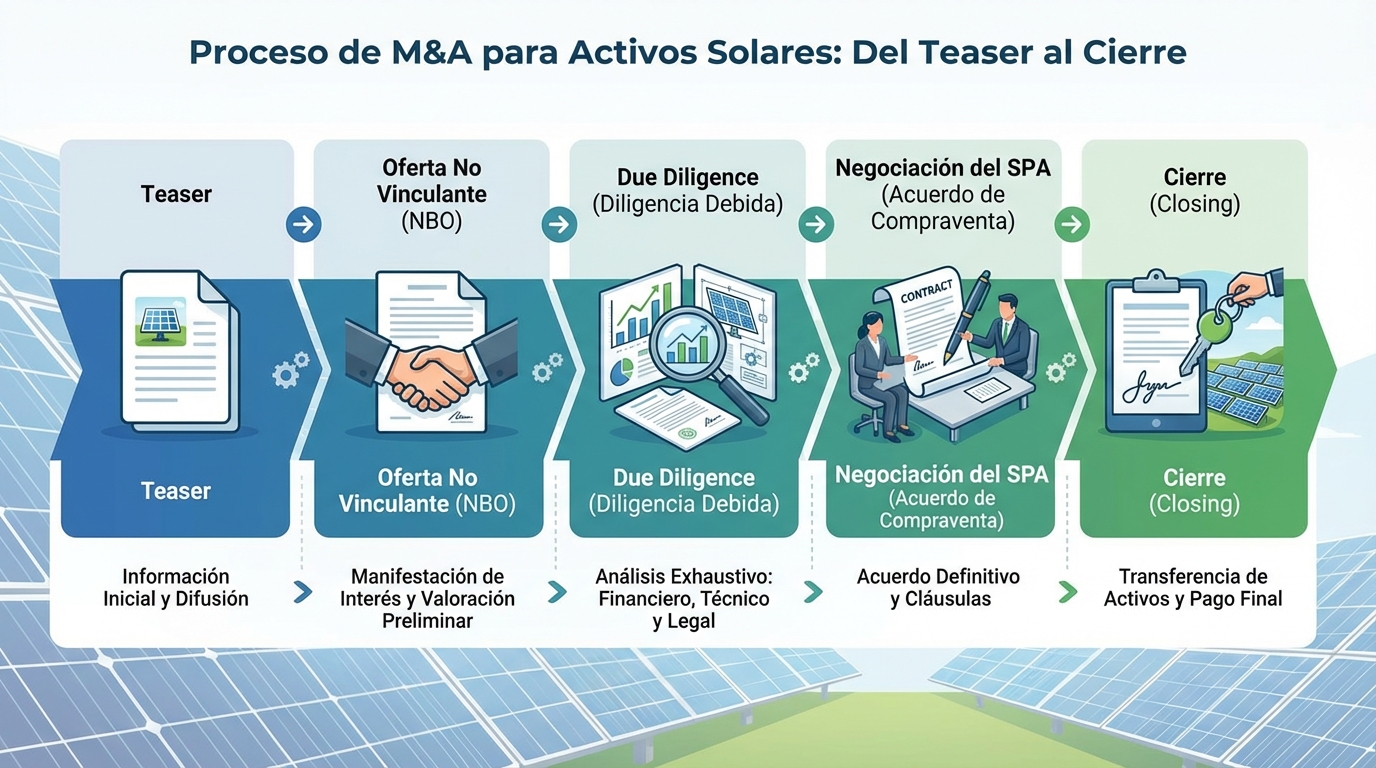
4. Typical M&A transaction process
Timeline (6-12 months)
Phase 1: Preparation (2-3 months)
| Action | Responsible | Deliverable |
|---|---|---|
| Teaser (1 page) | Seller + M&A advisor | Anonymous asset description |
| Target buyer list | M&A advisor | 20-30 funds/companies |
| Data room preparation | Seller | 150-300 scanned documents |
| Indicative Bids (IOI) | Buyers | Non-binding price range |
Phase 2: Due Diligence (2-4 months)
| DD Type | Duration | Typical Cost |
|---|---|---|
| Technical | 4-6 weeks | €40,000 - 80,000 |
| Legal | 3-4 weeks | €30,000 - 60,000 |
| Financial | 2-3 weeks | €20,000 - 40,000 |
| Environmental | 2 weeks | €10,000 - 20,000 |
| Insurance | 1-2 weeks | €5,000 - 10,000 |
Phase 3: Negotiation (1-2 months)
- Binding Offer
- Share Purchase Agreement (SPA) draft
- Warranties negotiation (seller guarantees)
- Price adjustments negotiation
- Escrow agreements (guarantee funds)
Phase 4: Closing (1 month)
- SPA signing
- Obtaining conditions precedent (regulatory approvals)
- Financial closing (payment)
- SPV transfer (owner company)
5. Transaction structures
A. Share Deal (Purchase of SPV shares)
Description: Buy 100% of shares of company that owns the plant.
Advantages:
- Permits and contracts don’t change owner (simplifies procedures)
- Tax advantage: doesn’t pay ITP (Property Transfer Tax)
Disadvantages:
- Buyer assumes hidden liabilities of company
- Requires extensive warranties from seller
Use: 90% of transactions
B. Asset Deal (Asset purchase)
Description: Buy assets (panels, inverters, permits) without acquiring company.
Advantages:
- Don’t inherit company liabilities
- Cleaner accounting
Disadvantages:
- ITP: 4-6% of value (depending on region)
- Permits and contracts must be transferred (slow and complex)
Use: Rare (< 10% transactions)
C. Forward Purchase Agreement (FPA)
Description: Buy plant under construction, with closing at future date (COD).
Advantages (for seller/developer):
- Capital secured before building
- Reduces construction risk (buyer often assumes cost overruns)
Advantages (for buyer):
- Price fixed before (can be discount vs secondary market)
- Control over technical specifications
Use: Common in plants > 50 MW with institutional buyers
6. Secondary market agents
Buyers (Buy-side)
| Type | Typical Deal Size | Investment Horizon | Target IRR |
|---|---|---|---|
| Infrastructure funds | €50-500M | 15-25 years | 7-10% |
| Utilities | €20-200M | Indefinite | 8-12% |
| Family Offices | €5-50M | 10-20 years | 10-15% |
| Private Equity | €30-300M | 5-7 years (exit) | 15-20% |
| Listed Yieldcos | €50-300M | Indefinite | 8-11% |
Main funds active in Spain (2025-2026): Several international and national infrastructure funds are actively operating in the Spanish secondary market. Want to know which ones? Contact us to access this information.
Sellers (Sell-side)
| Profile | Sale Reason |
|---|---|
| Build-to-sell developers | Business model (capital rotates quickly) |
| PE funds in exit | End of investment period (5-7 years) |
| Companies refinancing | Liquidity need or divestment |
| Opportunistic investors | Take advantage of high market prices |
M&A Advisors
Top advisors in Spain:
- Alantra (Solar M&A)
- EY Transaction Advisory
- PwC Deals
- Deloitte Financial Advisory
- Oaklins
Typical commissions: 1.5-3% of EV (decreasing scale by deal size)
7. Price trends 2023-2026
Multiple evolution
| Year | Average EV/EBITDA | Average €/MWp | Comment |
|---|---|---|---|
| 2021 | 10.5x | €750,000 | Post-COVID boom |
| 2022 | 12.0x | €850,000 | Energy crisis → high pool prices |
| 2023 | 13.5x | €950,000 | Market peak |
| 2024 | 11.0x | €880,000 | Correction (pool normalization) |
| 2025 | 9.5x | €820,000 | Multiple compression |
| 2026 (projection) | 9.0x | €800,000 | Stabilization |
2023-2026 fall drivers:
- Pool price normalization: From €80-100/MWh (2022) to €40-50/MWh (2025)
- Rising interest rates: From 0% (2020-2021) to 4% (2023-2026) → higher WACC
- Greater asset supply: 5 GW/year entering operation (buyer saturation)
- Growing curtailment: Saturated zones (Extremadura, CLM) lose value
8. Real transaction cases
Case A: 300 MW Portfolio (2024, Extremadura)
Seller: Spanish developer (build-to-sell) Buyer: European infrastructure fund Assets: 6 plants (50 MW average each) Characteristics:
- COD: 2022-2023
- PPA: 10 years @ €42/MWh
- PR: 81-83%
Valuation:
- Total EV: €270M
- €/MWp: €900,000
- Annual EBITDA: €24M
- EV/EBITDA: 11.25x
Structure: Share deal, 100% payment at closing
Case B: 75 MW Plant (2025, Andalusia)
Seller: Spanish utility (divestment) Buyer: European Yieldco Characteristics:
- COD: 2020
- Merchant (no PPA)
- PR: 82.5%
- Curtailment history: 1.2%/year
Valuation:
- EV: €60M
- €/MWp: €800,000
- Annual EBITDA (3-year average): €8.5M
- EV/EBITDA: 7.05x
Structure: Share deal, €3M escrow (5%) for warranties for 18 months
Comment: Low multiple reflects spot market exposure (no PPA).
Case C: 15 MW Plant (2025, Castilla-La Mancha)
Seller: Family office Buyer: Private equity Characteristics:
- COD: 2018
- PPA expires in 2027 (2 years remaining)
- PR: 78% (low, historical inverter problems)
- Curtailment: 6%/year (saturated zone)
Valuation:
- EV: €9M
- €/MWp: €600,000 (low vs market)
- Annual EBITDA: €1.8M
- EV/EBITDA: 5.0x
Price adjustments:
- -15% for short PPA
- -10% for low PR
- -8% for high curtailment
- Total discount: -33% vs benchmark
Structure: €1.5M escrow for defective inverter replacement
9. Strategies to maximize value in sale
For sellers
1. Optimal timing
- Year 3-5 post-COD: Sufficient operational history to validate performance, but equipment still under warranty
- Before PPA expiration: If PPA expires in < 2 years, renegotiate before selling
- Avoid selling in Q4: Buyers usually have exhausted budgets (better Q1-Q2)
2. Pre-sale preparation (6-12 months before)
| Action | Impact on Valuation |
|---|---|
| Renew O&M contract (if expiring soon) | +3-5% |
| Repair defective equipment (improve PR) | +5-10% |
| Obtain low curtailment certificate (from REE) | +3-5% |
| Renew land lease (if < 15 years) | +5-8% |
| Independent technical audit | +2-3% (credibility) |
3. Asset marketing
- Professional teaser: Hire M&A advisor (commission recovers with surplus)
- Maximize competition: Minimum 5-7 buyers in process (generates price tension)
- Controlled auction: Better than bilateral (can raise price 10-15%)
For buyers
1. Risk analysis
- Confirm real history: Request full SCADA access (not just summaries)
- Validate capture price: Cross hourly production with OMIE prices (detect revenue inflation)
- Verify curtailment: Request REE emails/notifications (not just aggregate data)
2. Warranty negotiation
Critical warranties (seller responsibility post-closing):
| Warranty | Typical Duration | Cap (Liability Limit) |
|---|---|---|
| Minimum production | 2-3 years | 10-20% of price |
| Minimum PR | 2 years | 5-10% of price |
| Absence of hidden defects | 18 months | 5% of price |
| Legal compliance | No time limit | 100% of price |
Strategy: Demand broad warranties if due diligence found red flags.
3. Escrow structuring
- Typical escrow: 5-10% of price retained 12-24 months
- Use: Cover warranty claims or necessary repairs
10. Conclusion: A mature market but with opportunities
The secondary market for photovoltaic plants in Spain has gone from being a niche (2015-2019) to a mature and liquid segment (2025-2026), with transactions of > €3,500M annually.
Key conclusions:
- Multiples have compressed (from 13-14x in 2023 to 9-10x in 2026), but remain attractive for sellers who bought/built with low CAPEX
- Long PPAs still rule: Valuation difference can be 3-5x EBITDA between merchant and PPA > 10 years
- Due diligence is critical: Superficial DD can cost you 10-20% of value (hidden problems)
- Timing is key: Selling in year 3-5 post-COD maximizes value (history + active warranties)
2026-2028 Projections:
- Transaction volume will remain (€3,000-4,000M/year)
- Multiples will stabilize at 8.5-10x for assets with PPA
- Plants with chronic curtailment will see growing discounts (up to -30%)
- Repowering will create new wave of transactions (2010-2015 plants with obsolete technology)
Are you considering selling your plant or portfolio? 👉 Contact us