Generation Comparison: Why do two identical plants produce different energy?
Introduction
Imagine this scenario: two neighbors, Juan and Pedro, buy exactly the same solar kit. Same panel model (500W), same inverter and same number of panels. However, at the end of the year, Juan’s plant has generated 8,000 kWh, while Pedro’s has barely reached 6,500 kWh. Pedro thinks his equipment is defective, but the reality is very different.
In solar energy, hardware is only half the equation. The other half is geometry and geography.
In this post, we analyze why the location and design of the installation are critical factors and how small variations in degrees or coordinates can drastically change the profitability of a project.
Section 1: The “Fuel” of the system: Solar Irradiation by Zone
The most common mistake is thinking that the sun “shines equally” everywhere. Solar irradiation (measured in kWh/m²) is the fuel for your panels.
An installation in Sevilla (Southern Spain) receives much higher annual irradiation than one in Bilbao (North). Even within the same province, the presence of mountains or microclimates affects production.
- High irradiation zone: ~1,800 - 2,000 kWh/m²/year.
- Medium irradiation zone: ~1,400 - 1,600 kWh/m²/year.
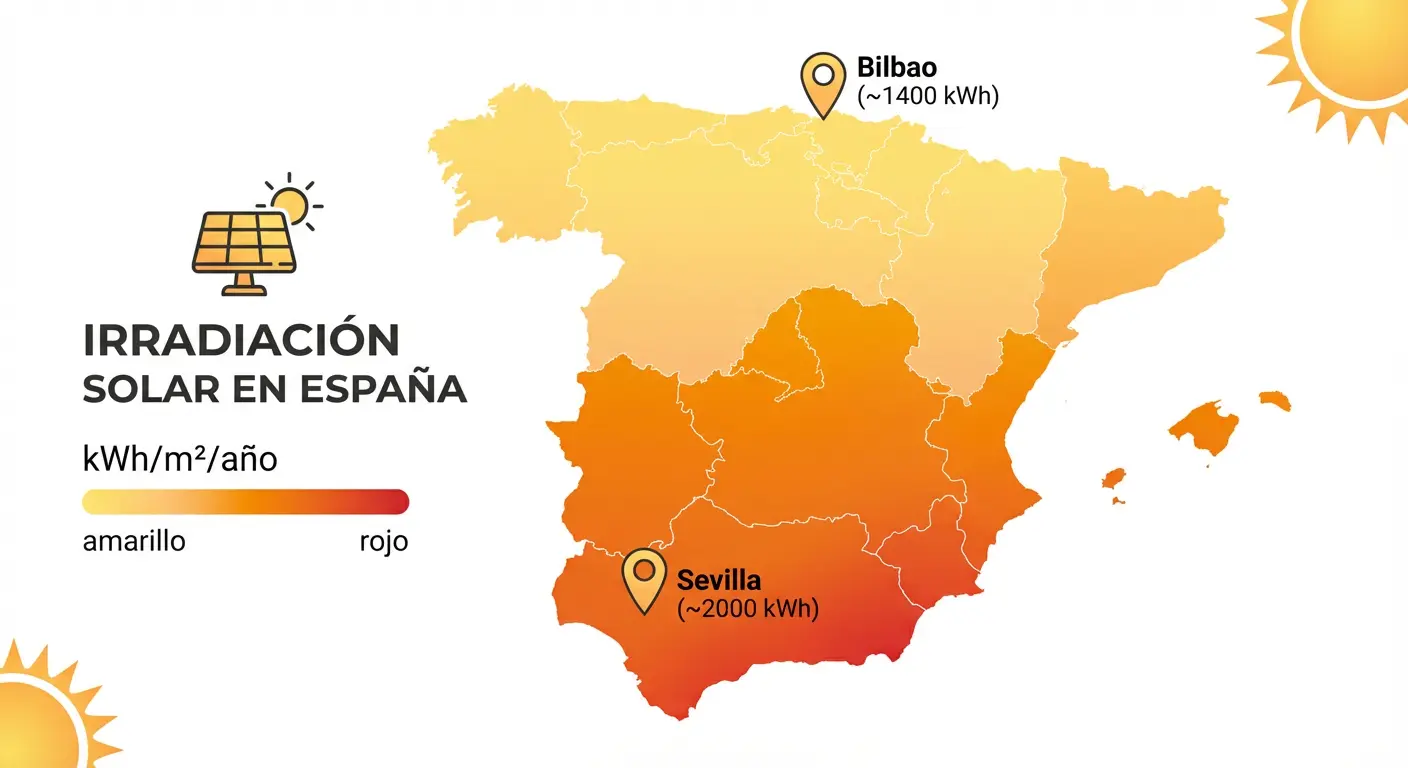
Before installing, it is vital to consult meteorological databases (such as PVGIS or those we integrate in PV Maps) to have a realistic estimate. You cannot promise the same numbers to a client in Galicia as to one in Murcia.
Section 2: Orientation (Azimuth) - Always South?
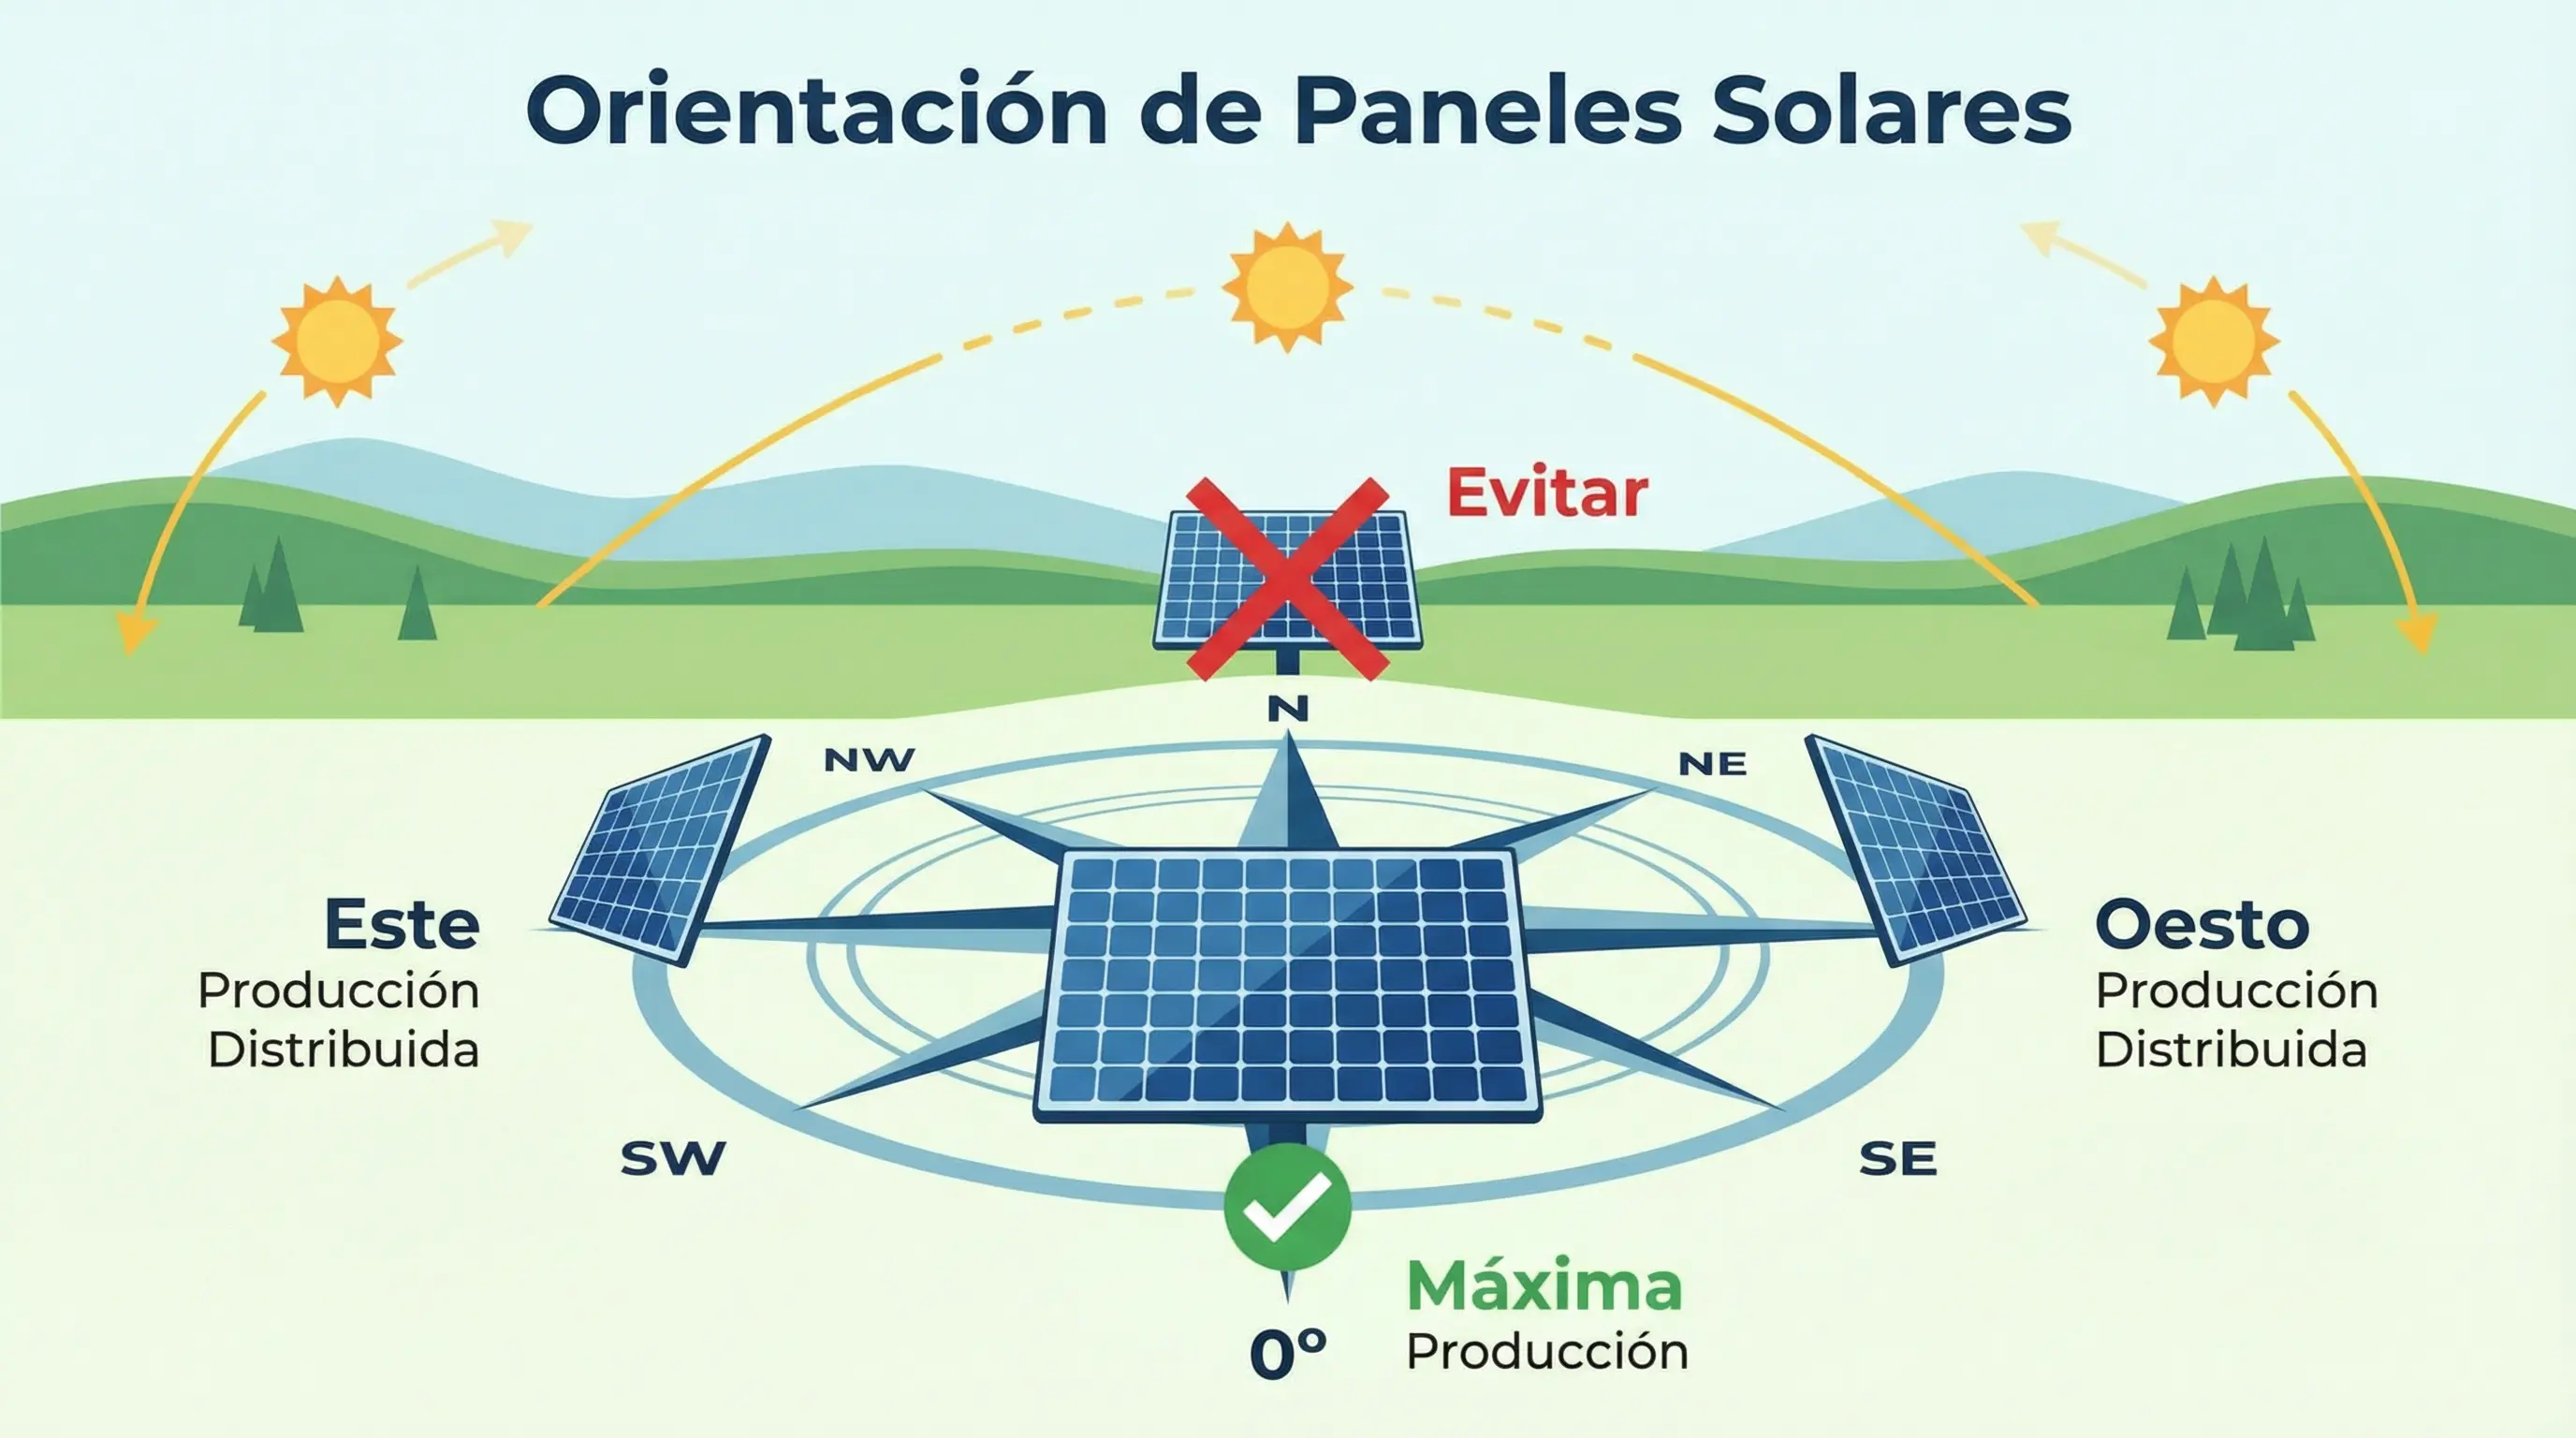
The golden rule in the northern hemisphere is: “Panels oriented to Geographic South”. This maximizes total energy capture throughout the day. However, deviating has consequences:
- South (0º): Maximum total production. Ideal for selling surplus.
- East-West: Produces less in total, but distributes energy better at sunrise and sunset. It is an increasingly popular strategy in the residential sector to maximize direct self-consumption before going to work or when returning.
- North: Except for very specific cases or bifacial panels on the ground, it should be avoided. Losses are drastic.
A 45º deviation towards the West can mean an annual loss of 5% to 10%, something you should simulate before going up on the roof.
Section 3: Tilt and seasonality
The sun is not at the same height in summer as in winter. The tilt of the panels seeks the optimal angle to capture rays perpendicularly most of the time.
- Optimal Tilt: Usually coincides with the latitude of the place (approx. 30º-40º in Spain).
- Flat Roofs (Coplanar): Sometimes, for aesthetics or wind resistance, panels are installed flat (0º-10º). This reduces annual production and, very importantly, prevents self-cleaning by rain, accumulating dirt that lowers performance.
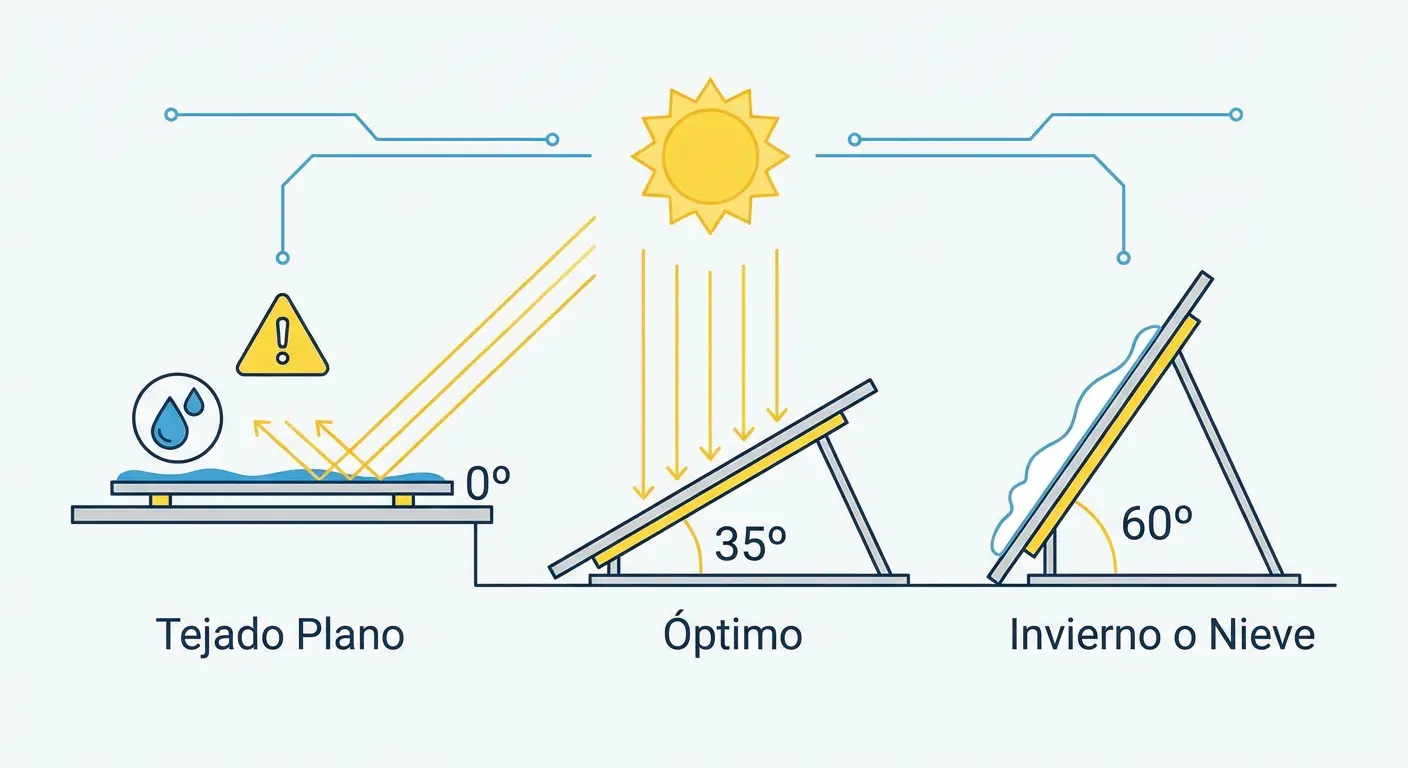
A 10-degree error in tilt is less serious than an error in orientation, but still affects final production, especially in winter.
Section 4: The impact of Temperature and Shadows
Sometimes, two identical plants with the same orientation produce differently because one “breathes” better than the other.
- Ventilation: Above-roof panels (with air space underneath) cool better than those integrated into the roof. Remember that heat reduces efficiency.
- Distant shadows: A building or mountain on the horizon can cut hours of direct sun at sunrise or sunset, reducing “peak” solar hours.
Section 5: Simulate before installing with PV Maps
Calculating all these variables by hand (Solar trigonometry + Meteorological data + System losses) is complex and slow. But doing it “by eye” is financial irresponsibility.
At PV Maps, we have developed a specific tool for this: Compare Generation.
- Visualize how the production curve changes according to parameters.
- Compare real data from your existing plants to detect anomalies.
- Generate reliable estimates based on historical data.
Conclusion
There are no two identical solar plants because there are no two identical locations. As an installer or owner, your goal is not just to buy good panels, but to place them in the exact place where physics allows them to shine.
Stopping guessing and starting to simulate is the first step to guarantee return on investment.
Do you have questions about how much your next installation will produce? Enter your dashboard and use our Compare Generation tool to get accurate data in seconds.