
Solar Irradiance in Spain: Interactive Map by Province (2026)
Introduction
“How much energy will my plant produce?” It’s the first question every photovoltaic project developer must answer. The answer doesn’t depend only on installed power, but mainly on how much solar radiation your specific location receives.
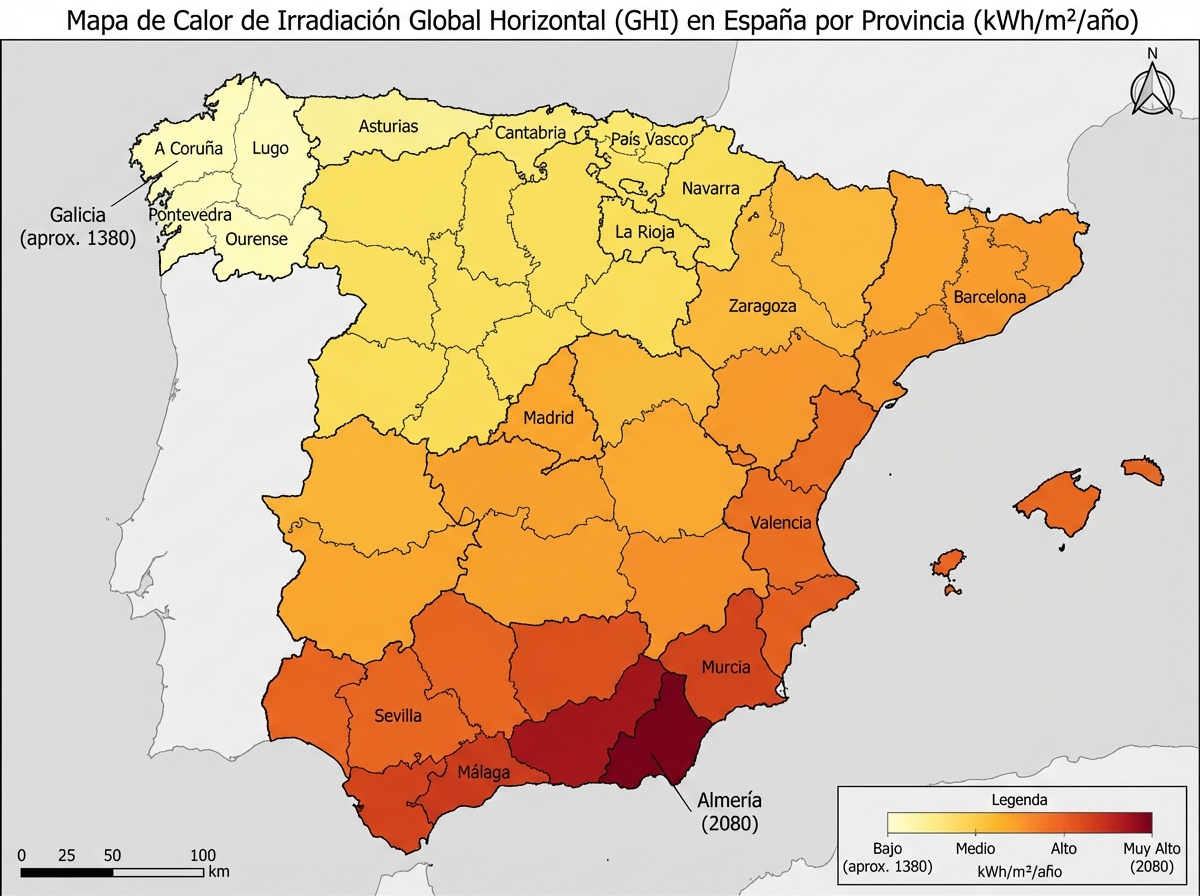
Spain is one of the countries with the highest irradiance in Europe, but differences between provinces are much greater than most people think: a plant in Almería can produce 35% more energy per MWp than an identical plant in A Coruña.
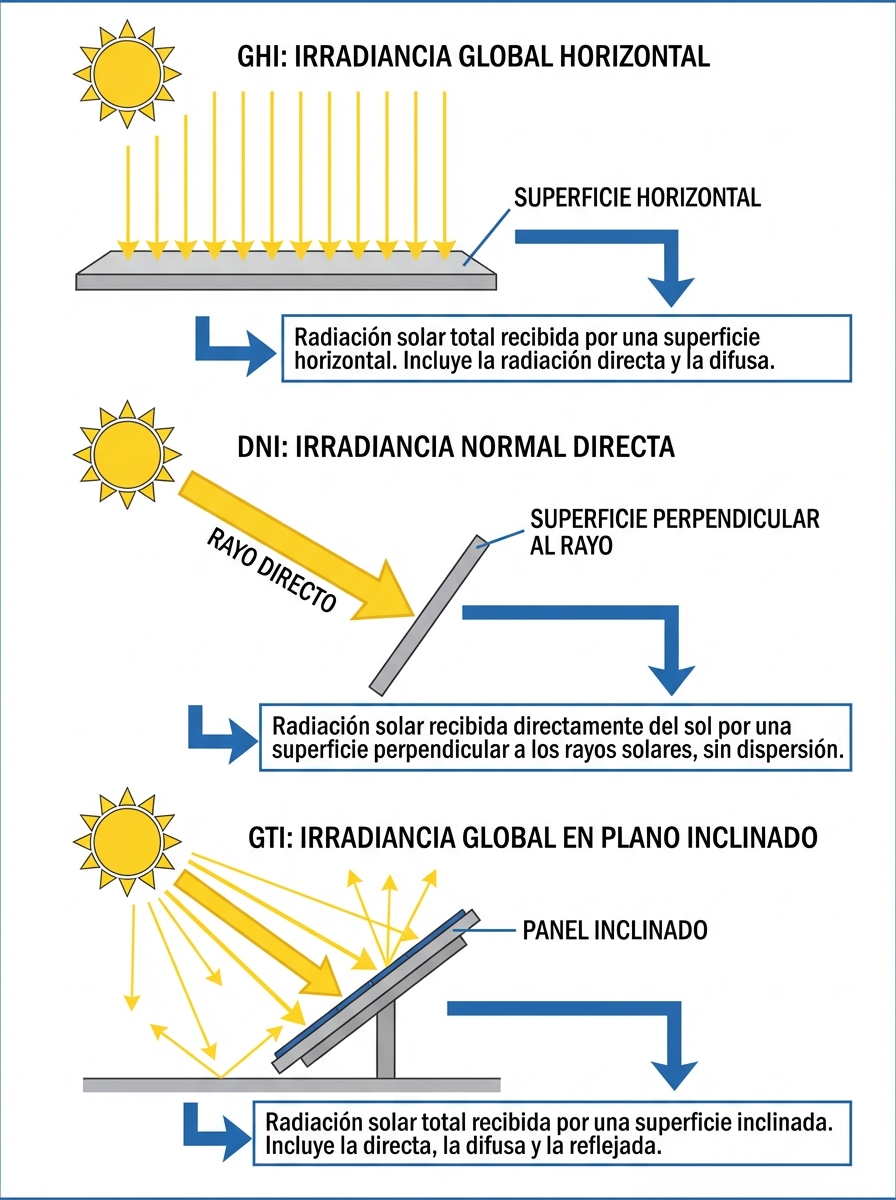
1. Basic Concepts: GHI, DNI, and GTI
Types of Irradiance
| Type | Description | Main Use |
|---|---|---|
| GHI (Global Horizontal Irradiance) | Total radiation on horizontal surface | General solar potential reference |
| DNI (Direct Normal Irradiance) | Direct radiation perpendicular to sun | Thermosolar plants (CSP) |
| GTI (Global Tilted Irradiance) | Radiation on tilted plane (optimal angle) | Photovoltaic plants ← Most relevant |
For fixed PV plants, GTI at optimal angle is 10-15% higher than GHI.
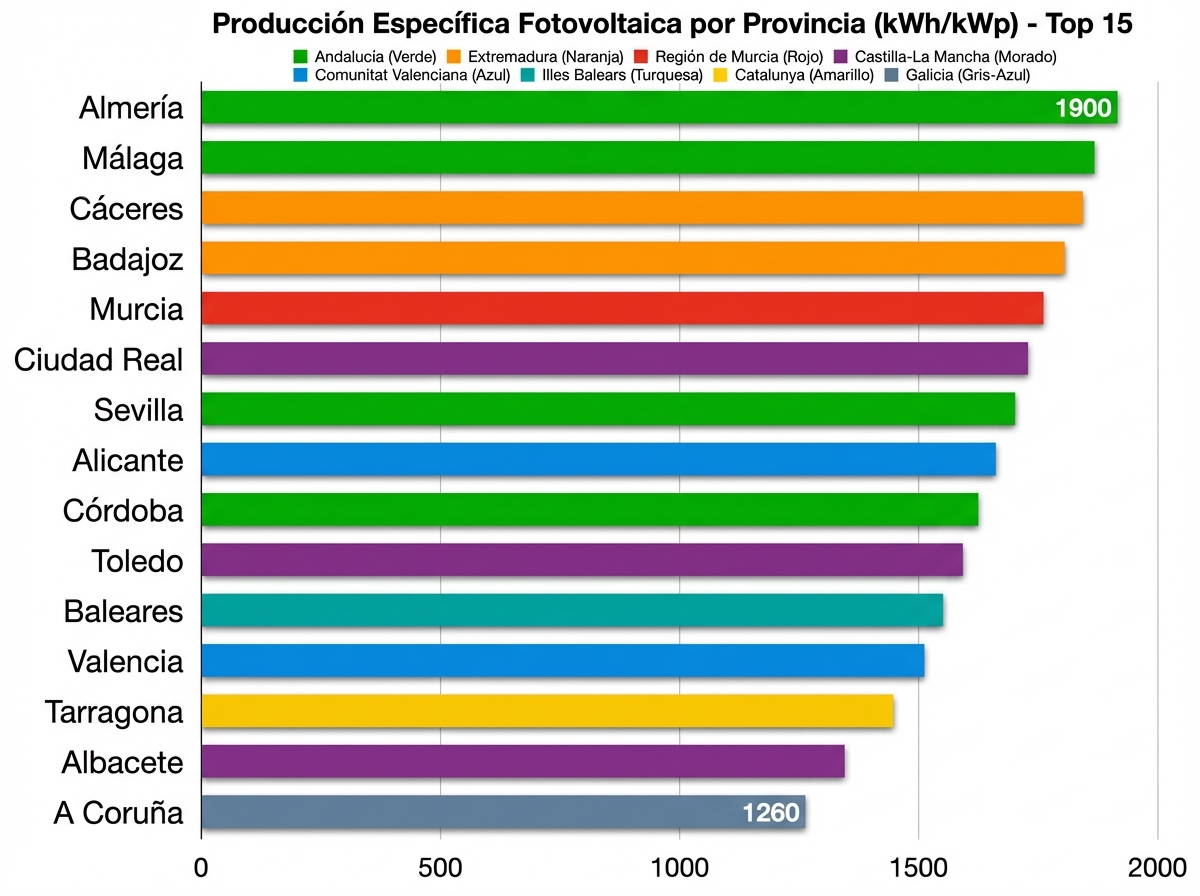
2. Province Ranking by GHI Irradiance
Top 10 Provinces (kWh/m²/year)
| Rank | Province | GHI | Estimated Production (kWh/kWp) | Region |
|---|---|---|---|---|
| 1 | Almería | 2,080 | 1,900 | Andalucía |
| 2 | Huelva | 2,010 | 1,850 | Andalucía |
| 3 | Cádiz | 1,990 | 1,830 | Andalucía |
| 4 | Sevilla | 1,950 | 1,810 | Andalucía |
| 5 | Badajoz | 1,930 | 1,780 | Extremadura |
| 6 | Málaga | 1,920 | 1,770 | Andalucía |
| 7 | Cáceres | 1,900 | 1,750 | Extremadura |
| 8 | Murcia | 1,890 | 1,740 | Murcia |
| 9 | Ciudad Real | 1,870 | 1,720 | Castilla-La Mancha |
| 10 | Córdoba | 1,860 | 1,710 | Andalucía |
Bottom 5 Provinces
| Rank | Province | GHI | Estimated Production (kWh/kWp) |
|---|---|---|---|
| 1 (last) | A Coruña | 1,380 | 1,260 |
| 2 | Lugo | 1,420 | 1,300 |
| 3 | Asturias | 1,450 | 1,320 |
| 4 | Vizcaya | 1,470 | 1,340 |
| 5 | Guipúzcoa | 1,480 | 1,350 |
Almería vs A Coruña difference: 50% more production per installed MWp
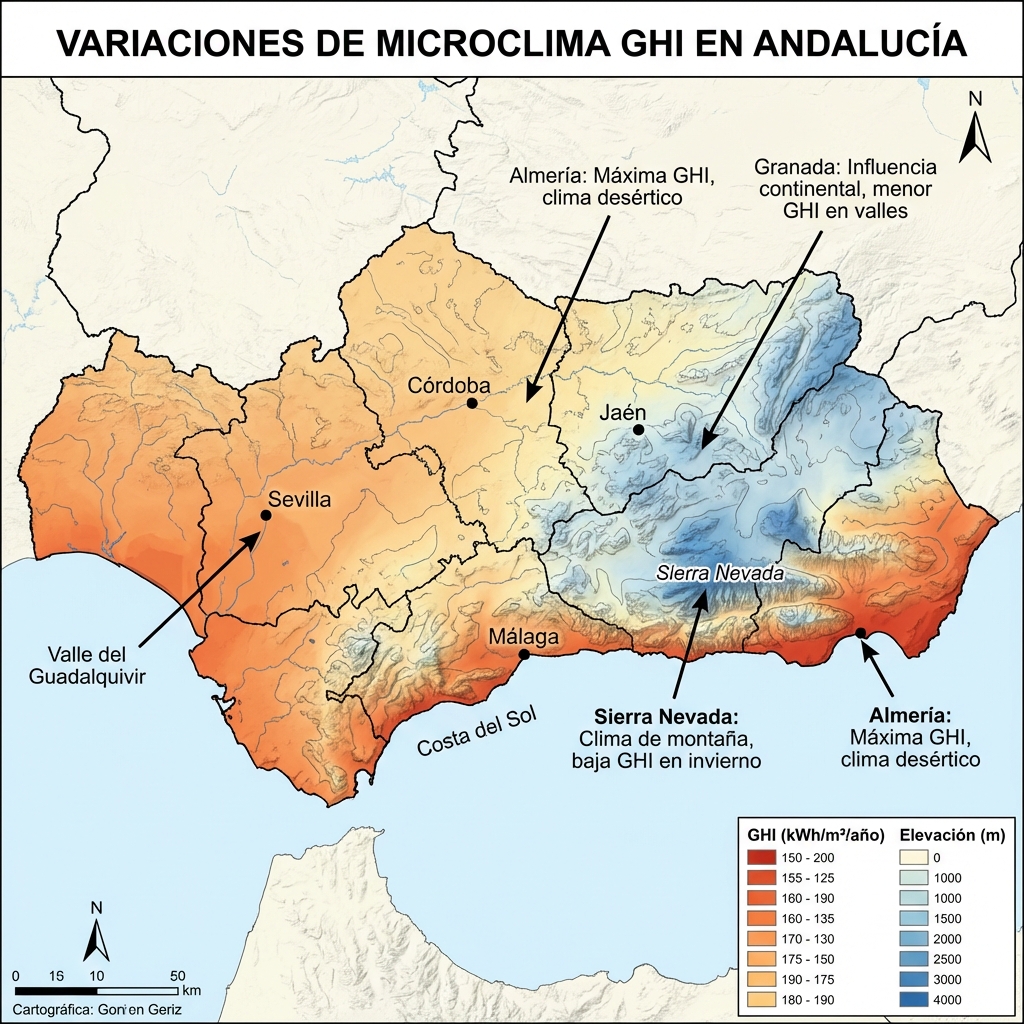
3. Microclimates: Why Two Plants 50 km Apart Can Produce Differently
Real Case: Almería vs Granada
- Almería (coast): 2,080 kWh/m²/year
- Granada (interior, 120 km away): 1,780 kWh/m²/year
- Difference: 17% less production in Granada
Microclimate causes:
- Altitude: Granada is at 700m altitude (more winter cloudiness)
- Sea proximity: Almería has more stable climate
- Mountain barriers: Sierra Nevada blocks northern fronts
Tools to Evaluate Microclimates
Don’t use only provincial data. Use tools that consider your exact location:
- PVGIS (free): Satellite data with 5-10 km resolution
- Solargis (commercial): 250m resolution, includes P50/P75/P90
- Meteonorm (commercial): Historical data from weather stations
4. PVGIS Integration in Development Phase
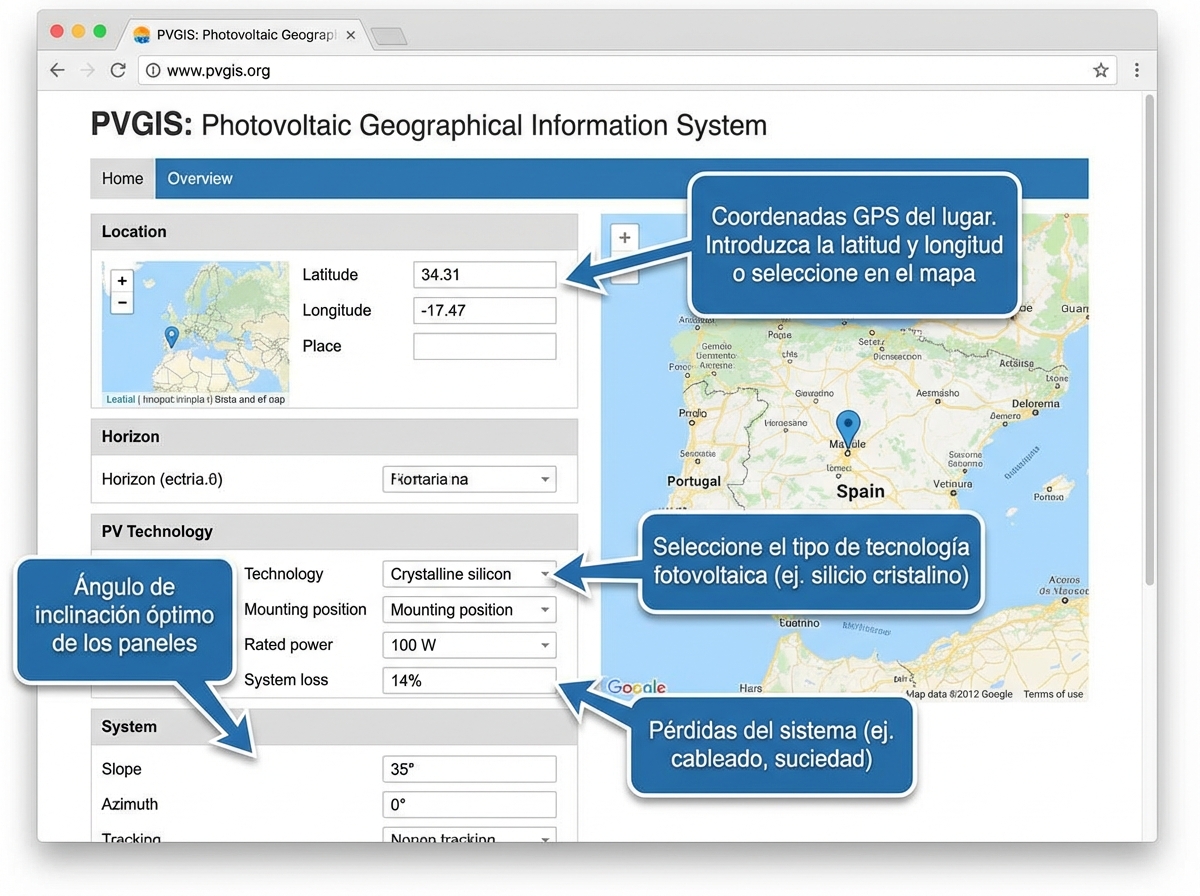
PVGIS (Photovoltaic Geographical Information System) is the European Commission’s free tool for calculating solar production.
How to Use PVGIS Correctly
Step 1: Access https://re.jrc.ec.europa.eu/pvg_tools/en/
Step 2: Enter exact coordinates of your project
Step 3: Configure parameters:
- Installed power: 1 kWp (to obtain kWh/kWp)
- Technology: Crystalline silicon
- Tilt: Optimal (or the one you plan to use)
- Azimuth: 0° (south, optimal for Spain)
- System losses: 14% (standard)
Step 4: Download hourly data (CSV) for financial modeling
Want to integrate PVGIS data into your financial model? 👉 Use our Excel template with PVGIS
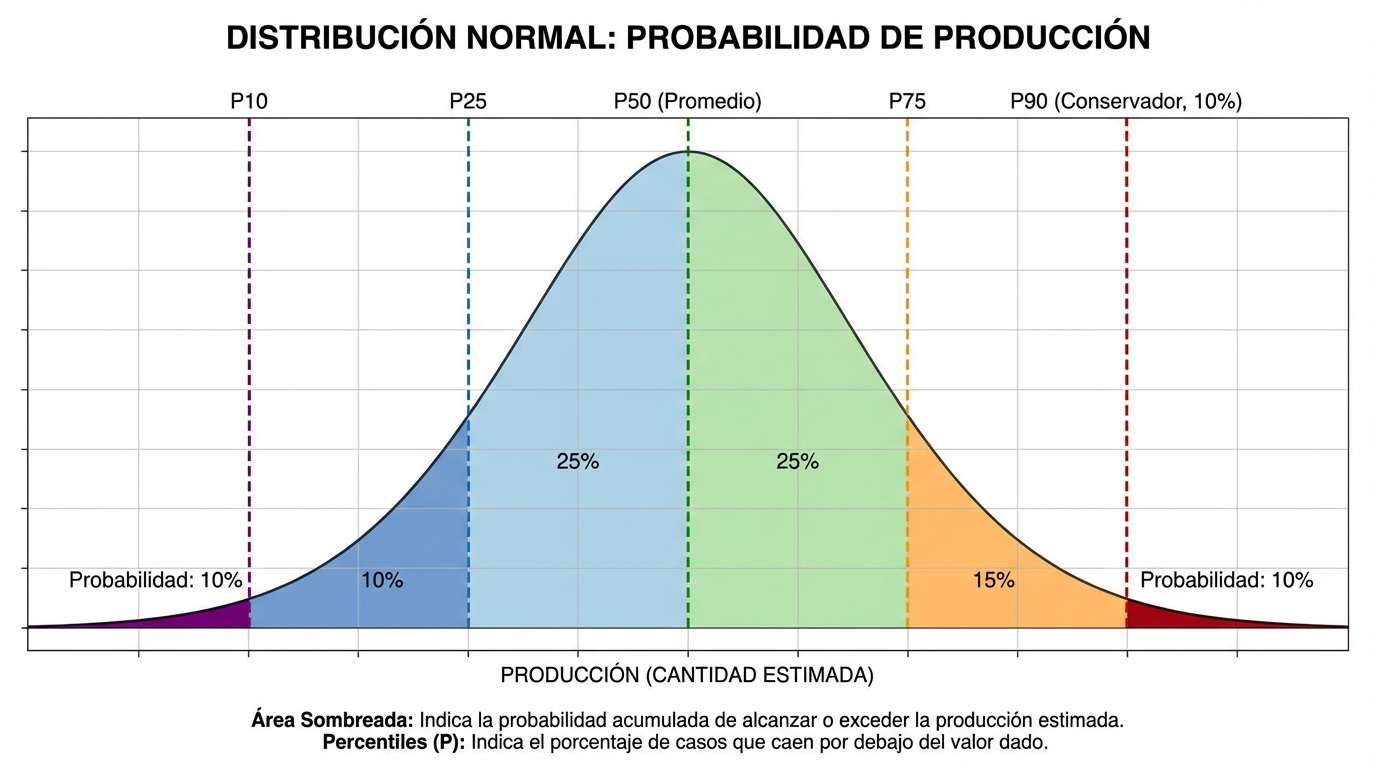
5. Interannual Variability: P50, P75, P90
Irradiance is not constant year to year. You must model production scenarios:
Production Percentiles
| Percentile | Description | Use |
|---|---|---|
| P50 | Average production (50% of years better, 50% worse) | Base case financial model |
| P75 | Conservative production (75% of years better) | Sensitivity analysis |
| P90 | Very conservative production (90% of years better) | Bank loan guarantees |
Example (10 MWp Plant in Sevilla):
- P50: 17,800 MWh/year
- P75: 16,800 MWh/year (-5.6%)
- P90: 16,000 MWh/year (-10.1%)
Financial implication:
- If you model with P50 but have a P90 year, you lose 1,800 MWh = 72,000 € @ 40 €/MWh
- Banks require that debt service be covered even in P90 scenario
Conclusion
Irradiance is the most critical factor in photovoltaic project viability. A 5% error in your irradiance estimate can translate into millions of euros difference in NPV for a 50 MWp project.
Keys:
- Use location-specific data (not provincial averages)
- Model interannual variability (P50/P75/P90)
- Validate with multiple sources (PVGIS + Solargis + nearby stations)
Want to see irradiance? 👉 Access our interactive irradiance map