Performance Ratio (PR): What It Is and How to Interpret It in Your Solar Plants
Introduction
You’ve invested thousands of euros in a photovoltaic installation. The panels are on the roof, the inverter is on, and electricity is flowing. But a critical question arises that every asset manager or owner asks themselves: Is the plant operating at 100% of its capacity or is it losing energy without you noticing?
Energy production (kWh) alone doesn’t tell you the whole story. A cloudy day will produce less, but that doesn’t mean the plant is malfunctioning. To know the real “health” of your system, you need the Performance Ratio (PR).
In this article, we’ll break down what PR is, why it’s the most important KPI on your dashboard, and how you can stop calculating it in Excel and automate it with professional tools.
Section 1: What Exactly Is the Performance Ratio (PR)?
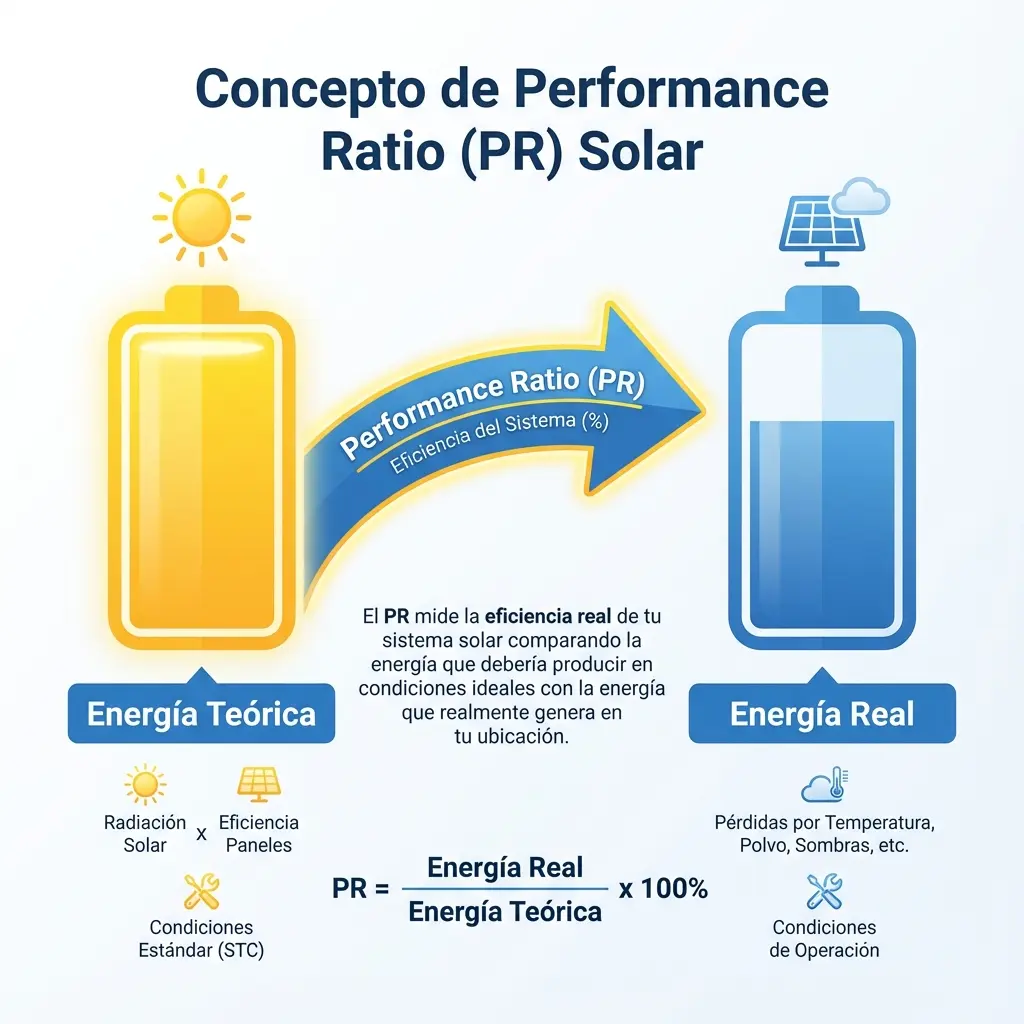
The Performance Ratio (PR) is a quality indicator, expressed as a percentage, that measures the efficiency of a photovoltaic plant regardless of the solar radiation it receives.
In simple terms: It’s the relationship between the energy your plant actually generated vs. the energy it theoretically should have generated.
The Correct Performance Ratio Formula
Although conceptually it’s a division between “actual” and “theoretical,” the IEC 61724 standard defines the standard formula as follows to ensure technical precision:
Let’s break down the terms to make it clear:
- (Actual Energy): It’s the useful electrical energy (in kWh) that the inverter has generated and fed to the grid or your consumption.
- (Peak Power): It’s the nominal power of your solar field (in kWp), that is, the sum of the power of all panels under ideal conditions.
- (Total Irradiance): It’s the accumulated solar radiation that has hit the plane of your panels during a period (in kWh/m²).
- (Standard Irradiance): It’s a constant reference value: 1 kW/m². It serves to balance the units of the formula.
If after applying the formula you obtain a PR of 80%, it means that of the 100% of theoretical solar energy that could have been converted into electricity, 20% was lost along the way (heat, component efficiency, dirt, wiring, etc.).
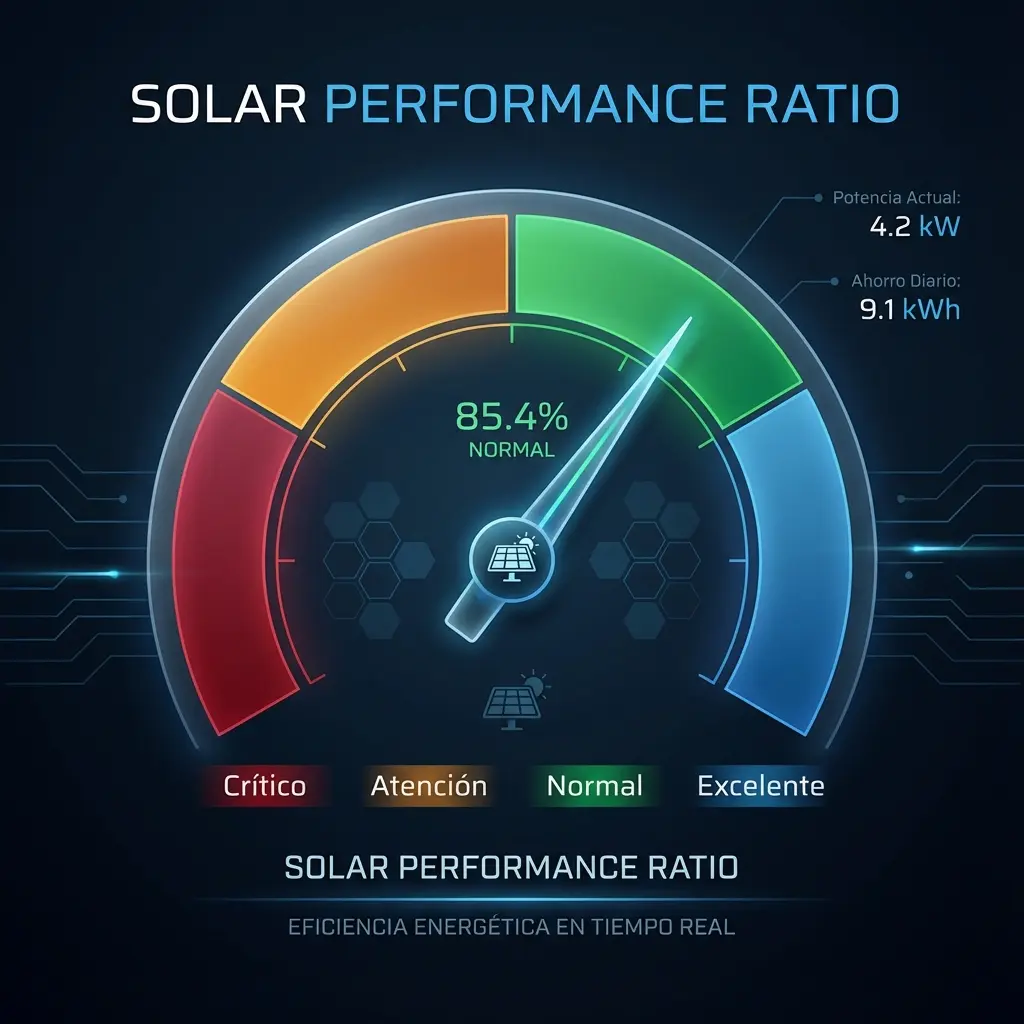
Section 2: Interpreting the Data: What Is a “Good” PR?
This is where most competitor articles fail. They give you the formula, but they don’t tell you if your number is good or bad. At PV Maps, after analyzing hundreds of plants, we use these reference ranges for 2024-2025:
| PR Range | Diagnosis | Recommended Action |
|---|---|---|
| > 85% | Excellent | New plant, cold climate, or high-efficiency systems. |
| 75% - 85% | Normal | Standard range for most well-maintained installations. |
| 60% - 75% | Attention | Possible dirt, partial shading, or temperature issues. |
| < 60% | Critical | Inverter failure, disconnected string, or severe degradation. |
Note: A PR of 100% is physically impossible due to the laws of thermodynamics and the electrical resistance of materials.
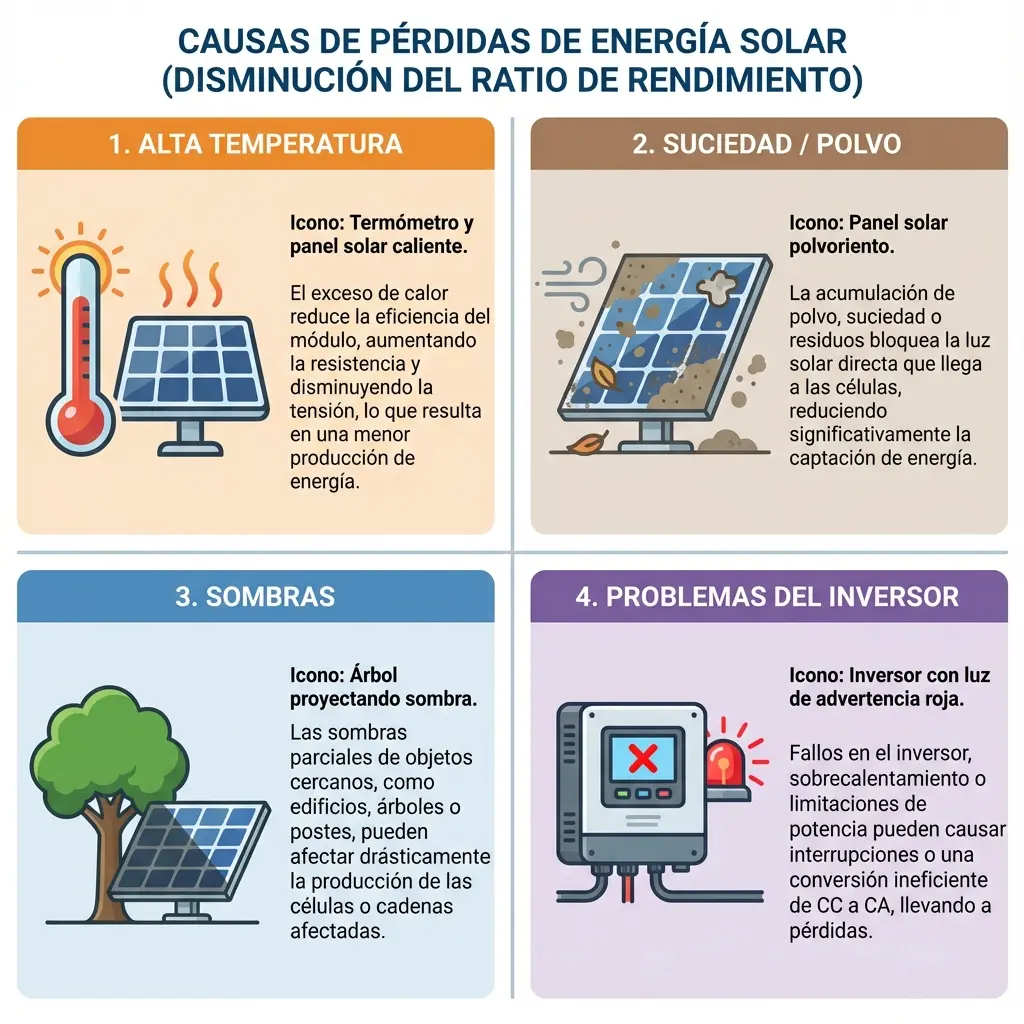
Section 3: The 4 Main Causes of Low PR
If when you enter your Solar Analytics section you see that performance has dropped, it’s usually due to one of these factors:
- Thermal Losses (The Sun’s Paradox): Solar panels hate excessive heat. For every degree that the cell temperature rises above 25°C, you lose efficiency (approx -0.35%/°C). In summer, paradoxically, your PR is usually lower than in winter.
- Dirt (Soiling): Dust, pollen, or bird droppings. In dry areas, this can reduce PR by 5-15% quickly.
- Unplanned Shadows: Trees that have grown or new constructions. Using tools like our Density Calculator helps avoid this in the design phase.
- Inverter Availability: If the inverter shuts down due to overvoltage or maintenance, PR drops sharply during that period.
Section 4: Difference Between PR and Capacity Factor
It’s vital not to confuse these two terms if you want to present professional reports:
- Performance Ratio (PR): Measures the quality of the installation (How well does it convert the light that’s available into electricity?).
- Capacity Factor: Measures the quantity of production relative to total time (24h/365d).
A plant in northern Europe can have an excellent PR (90%) because it’s cold (panels work better), but a low Capacity Factor because there are few hours of sun. On the contrary, a plant in the desert can have a lot of total production, but a lower PR due to losses from extreme heat.
Section 5: How to Automate the Calculation with PV Maps
Calculating PR manually requires crossing data from meters with data from pyranometers or weather satellites. Doing this in spreadsheets is error-prone and consumes hours of engineering time.
At PV Maps, we simplify this process in our Solar Analytics module:
- KPI Comparison: Visualize historical PR and automatically detect annual degradations.
- Compare Generation: Contrast the performance of different inverters or plants within your portfolio.
- Alerts: Detect if PR falls below the expected threshold according to the time of year.
If you’re already a user, you can access your performance dashboard directly here.
Conclusion
The Performance Ratio is the thermometer of your solar investment. Ignoring it is like driving a car without a dashboard: you may be moving, but you don’t know if the engine is about to fail or if you’re using more fuel than necessary.
Don’t wait to see an unexpected electricity bill to check your systems. Monitoring PR allows you to move from reactive maintenance (fix when it breaks) to proactive maintenance (optimize to earn more).
Want to calculate the real profitability and performance of your projects? Sign up for free at PV Maps and start managing your solar assets like a professional.