ROI in Photovoltaic Plants: How Long Does It Take to Recover Investment in Spain (2026)
Introduction
If you’re evaluating investing in a photovoltaic plant in Spain, the most important question isn’t how much energy it will produce, but how long will it take me to recover my investment? ROI (Return on Investment) and the payback period are the financial indicators that every asset manager, investor, or developer must master before signing an EPC or financing contract.
In 2026, the solar investment landscape in Spain has matured. Panel prices have stabilized, CAPEX costs have dropped 40% compared to 2020, and financing mechanisms are more accessible. But market price volatility (electricity pool) and grid restrictions introduce new variables that can make two identical plants have completely different ROIs.
In this article, we’ll break down step by step how to calculate the real ROI of a photovoltaic plant, analyze scenarios with and without PPA, with and without hybridization (BESS), and compare the payback time according to Spain’s climate zone. Additionally, we’ll review real cases of operating plants to validate these calculations with real-world data.

1. What Is ROI and How Is It Calculated in Photovoltaic Plants?
ROI (Return on Investment) measures the percentage return you get on your initial investment. The basic formula is:
For photovoltaic plants, net profit is the sum of revenues from energy sales minus operating costs (OPEX) over the project’s useful life (typically 25-30 years). The initial investment includes:
- Photovoltaic CAPEX: panels, inverters, structures, civil works, grid connection
- BESS CAPEX (if applicable): batteries, BMS, additional transformers
- Development costs: permits, engineering studies, guarantees
- Financing: bank loan interest (if not pure equity)
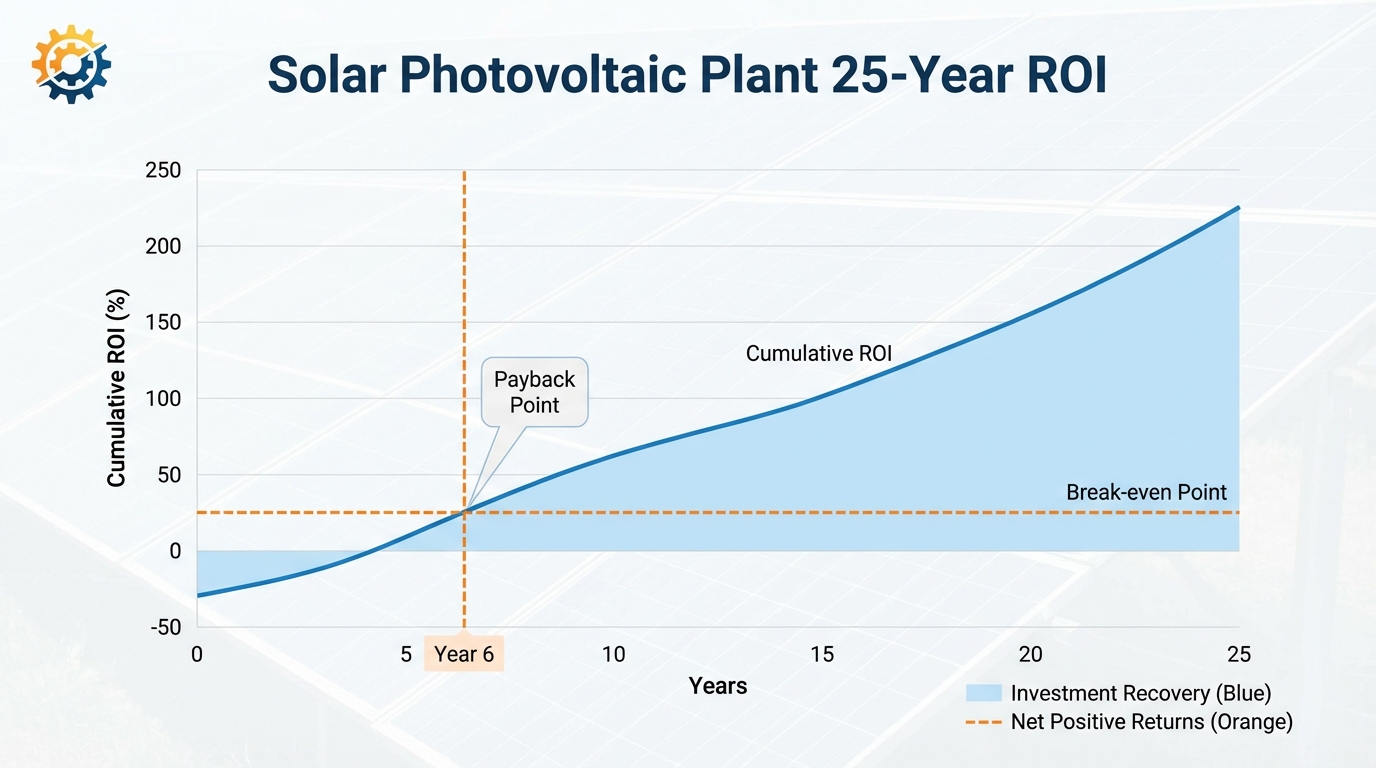
Payback Period (Return Time)
More relevant for many investors is the payback period: how many years will it take me to recover my initial investment? This indicator is more intuitive than ROI:
A payback of 6-8 years is considered excellent for large-scale plants in Spain. Above 12 years, the project starts to be less attractive to institutional investors.
2. Base Scenario: Plant without PPA in Spot Market
Let’s analyze a simplified real case of a 10 MWp plant in the province of Sevilla, selling energy to the pool market (without PPA):
Input Data (2026)
| Concept | Value |
|---|---|
| Installed capacity | 10 MWp |
| Total CAPEX | 5.5 M€ (550 €/kWp) |
| Estimated annual production | 17,500 MWh |
| Average captured price (pool) | 45 €/MWh |
| Annual OPEX | 80,000 € (8 €/kWp/year) |
| Financing | 70% debt, 30% equity |
| Cost of debt | 4.5% |
Flow Calculations
- Annual revenues: 17,500 MWh × 45 €/MWh = 787,500 €
- Annual OPEX: 80,000 €
- Gross cash flow: 707,500 €
- Debt service (70% of 5.5M€ at 4.5% over 15 years): ~320,000 €/year
- Free cash flow (equity): ~387,500 €/year
With an equity investment of 1.65 M€ (30% of 5.5M€), the payback on equity is:
Result: In an optimistic scenario with spot market at constant 45 €/MWh and without curtailment, the investor recovers their capital in 4-5 years.
⚠️ Operational Reality
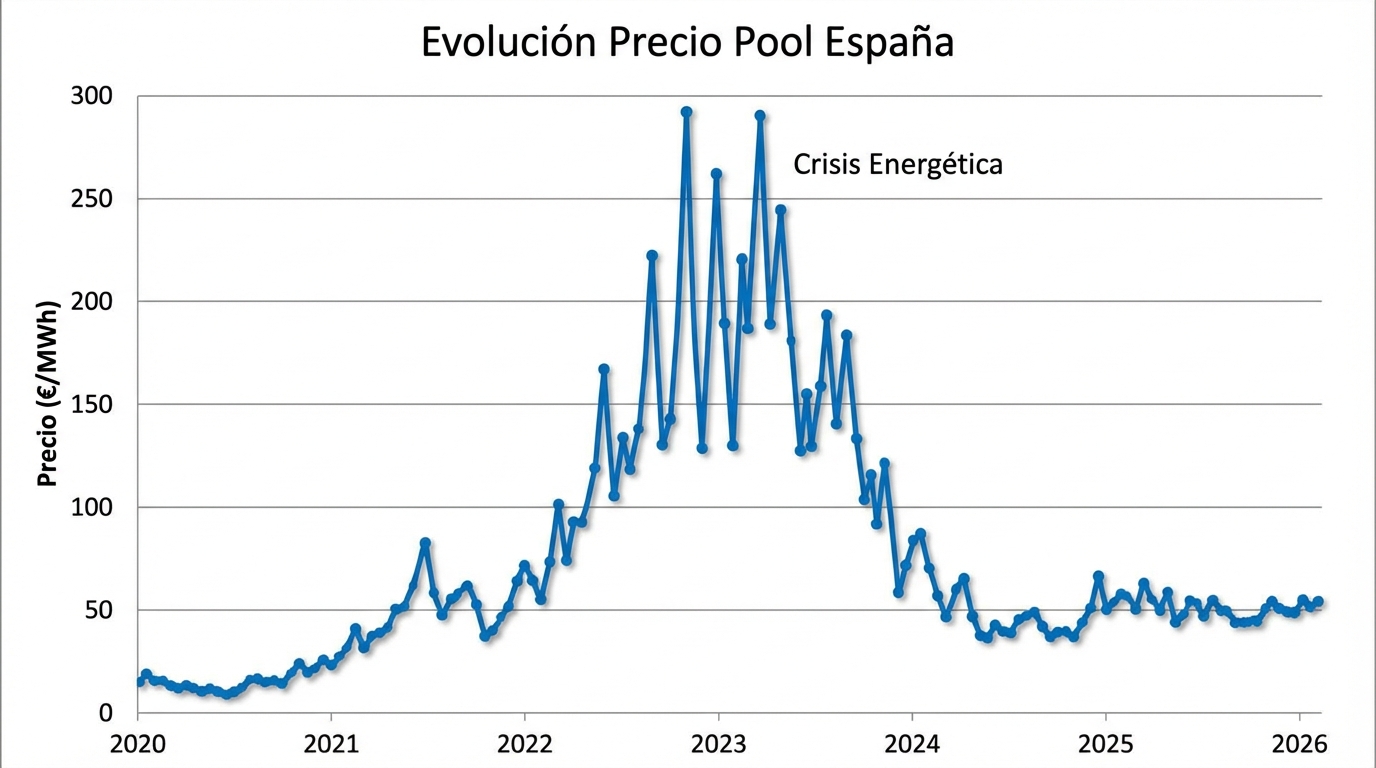
In practice, the average captured price fluctuates. In 2023 it was at 80 €/MWh (energy crisis), but in 2025 it fell to 35-40 €/MWh. This volatility makes many investors prefer the stability of a PPA.
3. Scenario with PPA: Stability vs Upside
A PPA (Power Purchase Agreement) is a long-term energy sales contract (10-15 years) with an off-taker (usually a utility or large industrial consumer).
PPA Advantages
- Guaranteed fixed price: eliminates market price risk
- Cheaper financing: banks value cash flow stability
- Predictable ROI: facilitates financial planning
PPA Disadvantages
- Lower capture price: PPAs usually pay 5-10 €/MWh less than the pool average
- Commercial rigidity: you can’t take advantage of price spikes
- Counterparty risk: if the off-taker goes bankrupt, you lose the contract
Same Case with PPA at 40 €/MWh
- Annual revenues: 17,500 MWh × 40 €/MWh = 700,000 €
- Free cash flow (equity): ~300,000 €/year
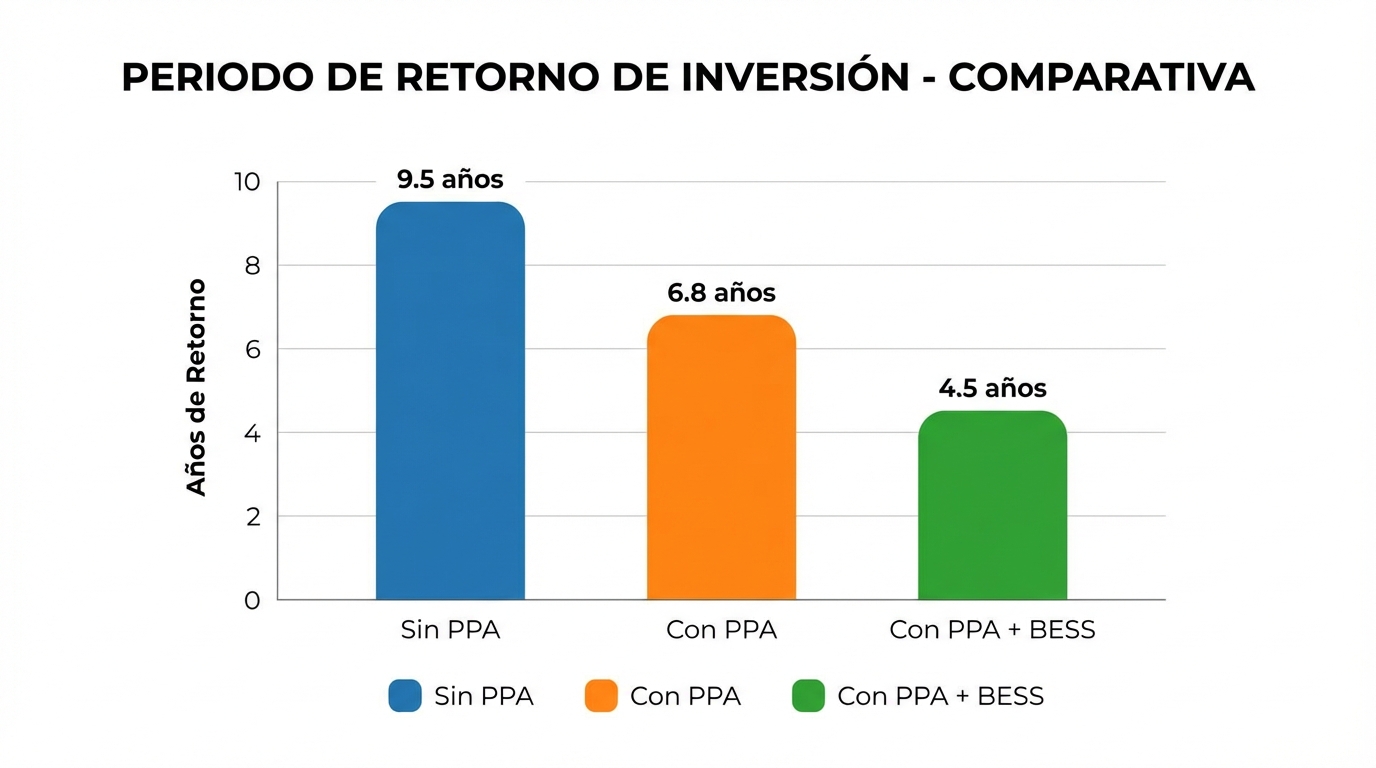
- Payback: 1,650,000 / 300,000 = 5.5 years
The payback increases by 1 year, but cash flow certainty reduces project risk. For conservative infrastructure funds, PPA is preferable even if it sacrifices some ROI.
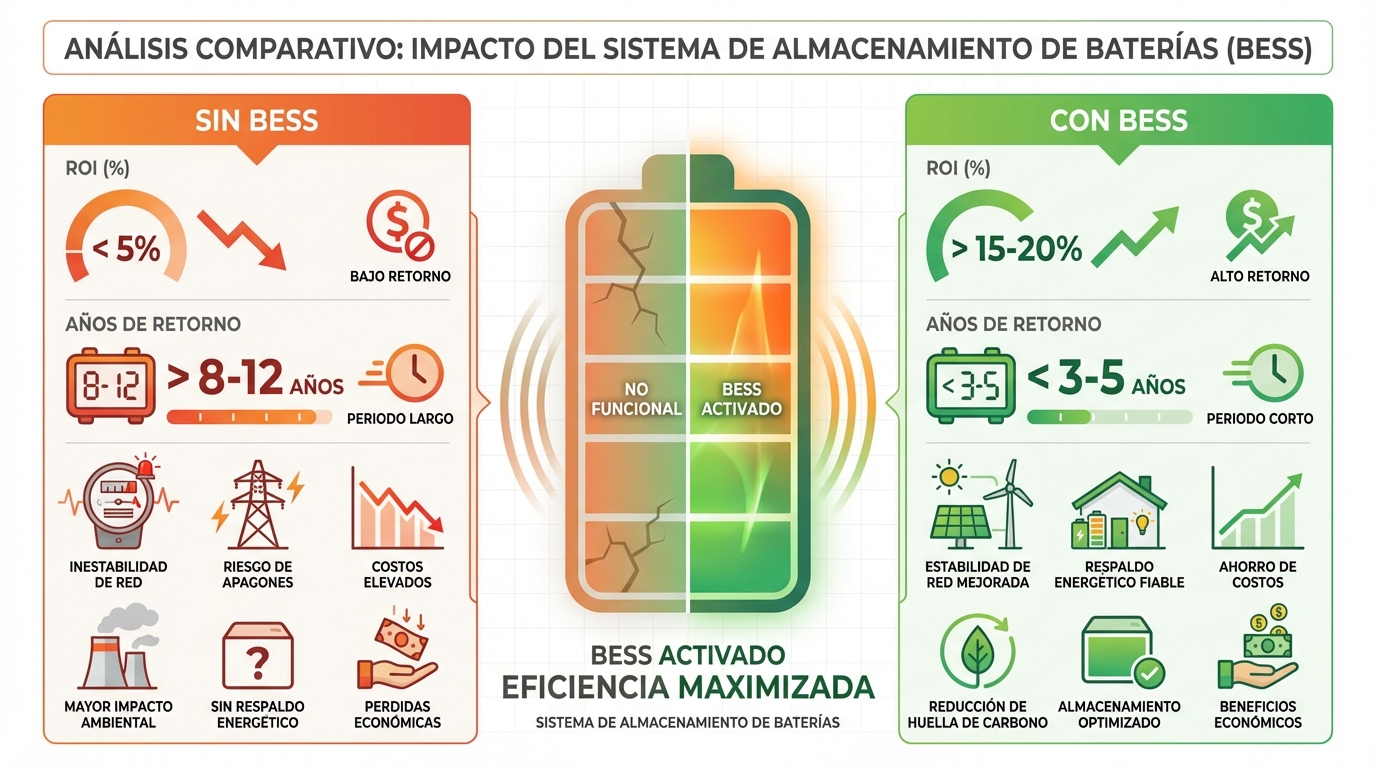
4. Impact of Hybridization (BESS)
Adding a battery system (BESS) to your photovoltaic plant can improve ROI if:
- Market arbitrage: you buy cheap energy (or store it from your own production) and sell it during higher price hours
- Ancillary services: you participate in secondary regulation markets (aFRR) with additional revenues of 50-150 €/MW/day
- Curtailment reduction: you avoid losing production during grid saturation hours
Case: 10 MWp Plant + BESS 2 MW / 4 MWh
- Additional BESS CAPEX: 1.2 M€ (300 €/kWh)
- Total investment: 6.7 M€
- Additional arbitrage revenues: +100,000 €/year (conservative)
- Grid services revenues: +80,000 €/year
New cash flow (without PPA):
- Total revenues: 787,500 + 100,000 + 80,000 = 967,500 €
- Free cash flow (equity): ~480,000 €/year
- Equity investment: 2.01 M€
- Payback: 2,010,000 / 480,000 = 4.2 years
Result: BESS can maintain or even improve payback if operated correctly, although it adds operational complexity and battery degradation risk.
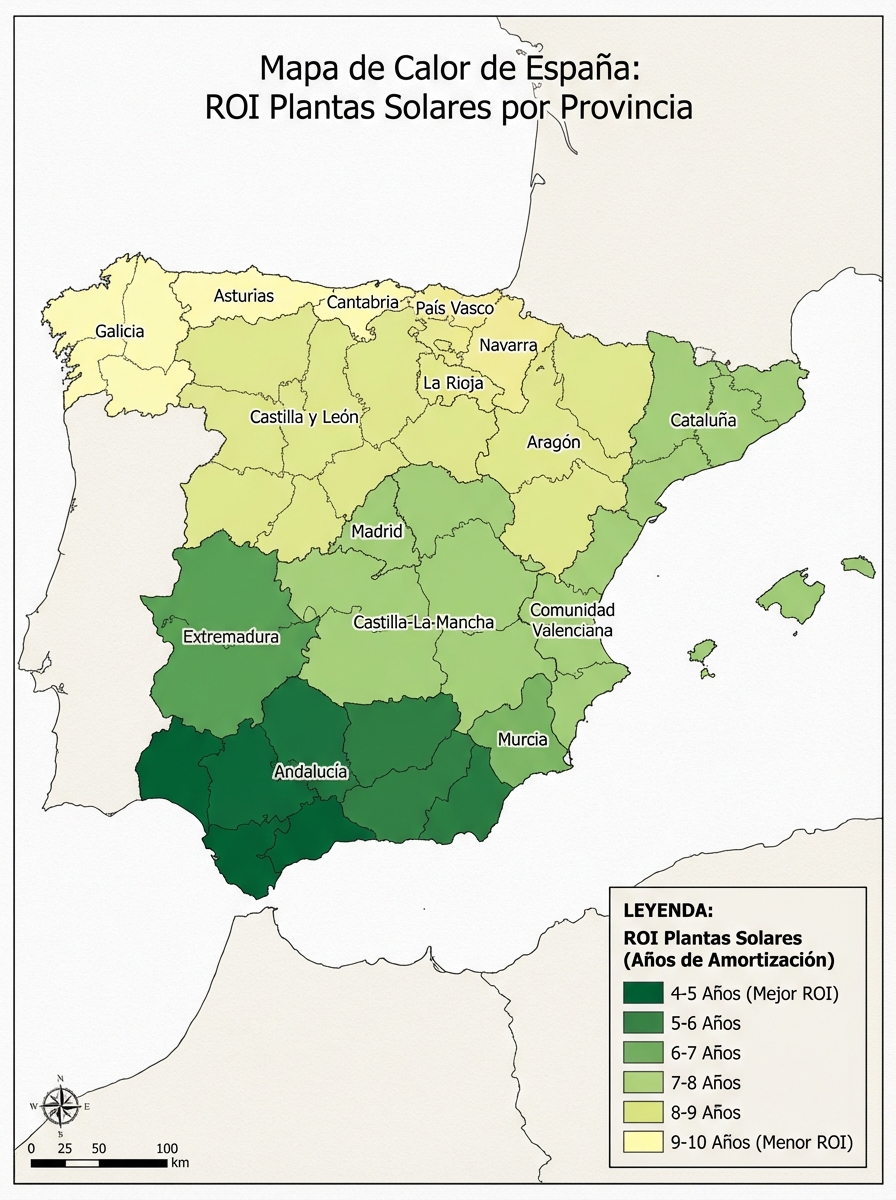
5. ROI by Climate Zone in Spain
Not all regions of Spain have the same return potential. Solar irradiance varies significantly between north and south:
| Zone | GHI Irradiance (kWh/m²/year) | Specific Production (kWh/kWp) | Estimated Payback |
|---|---|---|---|
| Andalucía (Sevilla, Málaga) | 1,900 - 2,000 | 1,750 - 1,850 | 4-5 years |
| Extremadura (Badajoz) | 1,850 - 1,950 | 1,700 - 1,800 | 5-6 years |
| Castilla-La Mancha (Albacete) | 1,800 - 1,900 | 1,650 - 1,750 | 5-6 years |
| Aragón (Zaragoza) | 1,700 - 1,800 | 1,550 - 1,650 | 6-7 years |
| Galicia (A Coruña) | 1,400 - 1,500 | 1,300 - 1,400 | 8-10 years |
Key lesson: A plant in Sevilla can have a 30-40% higher ROI than an identical plant in Galicia, simply due to available sun hours.
6. Real Cases: Analysis of Operating Plants
Let’s validate these calculations with data from real plants monitored at PV Maps:
Case A: Francisco Pizarro Plant (590 MWp, Cáceres)
- COD year: 2022
- Estimated CAPEX: ~300 M€ (508 €/kWp)
- First year production: 1,050 GWh
- Average captured price (2022-2023): ~60 €/MWh (high market)
- Estimated payback: 5-6 years (benefited by high post-crisis prices)
Case B: Medium-sized plant in Sevilla (25 MWp)
- COD year: 2024
- CAPEX: 14 M€ (560 €/kWp)
- Signed PPA: 38 €/MWh for 12 years
- Estimated payback: 7 years
Conclusion: Plants that came into operation during 2022-2023 benefited from extraordinary market prices, reducing their payback to 4-5 years. Post-2024 plants with conservative PPAs are seeing paybacks of 6-8 years.
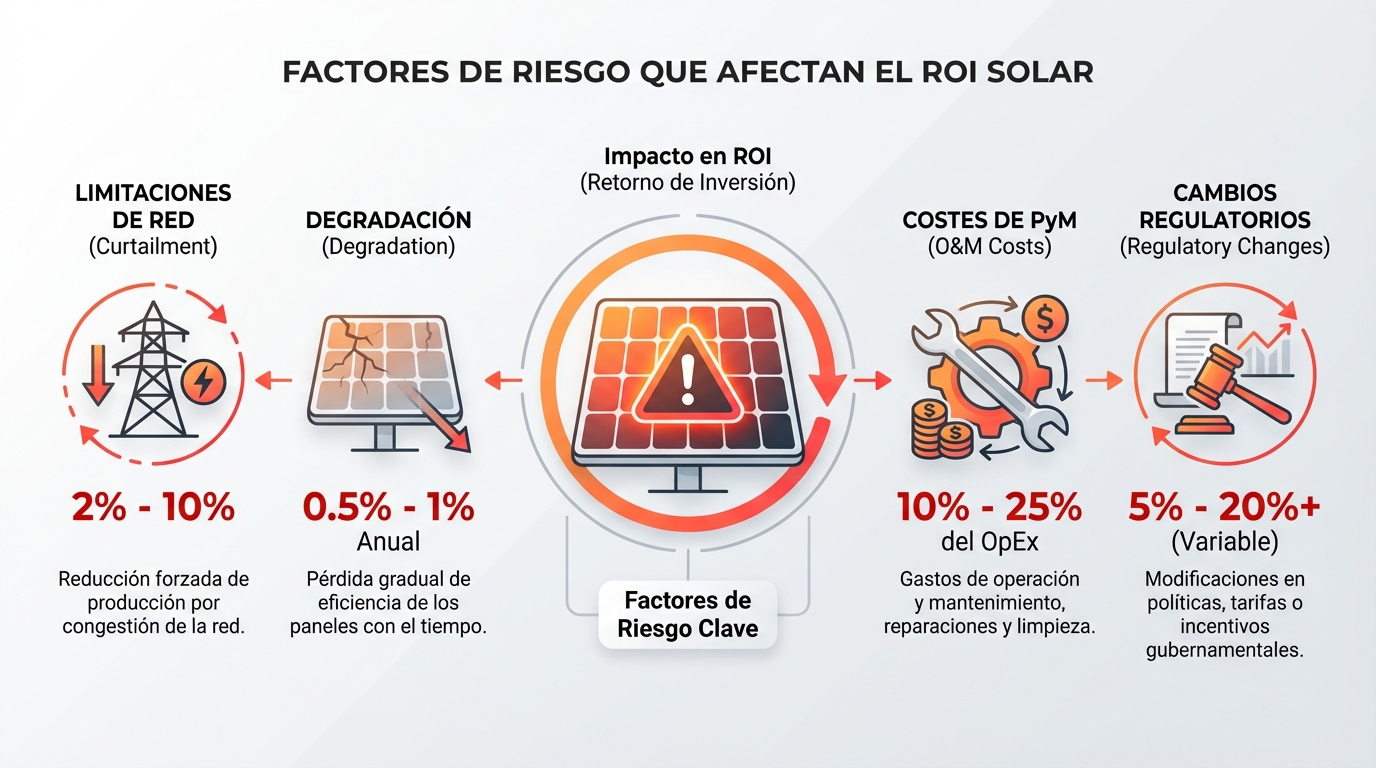
7. Factors That Can Ruin Your ROI
It’s not all about irradiance and market price. These factors can significantly extend your payback:
1. Curtailment (Forced Production Reduction)
In areas with grid saturation (Extremadura, Castilla-La Mancha), the system operator can order you to reduce your production. Plants at saturated nodes have reported losses of 5-10% of annual production from curtailment.
2. Accelerated Degradation
Panels degrade naturally by ~0.5%/year, but if you buy low-quality panels or there are installation problems, degradation can be 1-2%/year, reducing future revenues.
3. Underestimated O&M Costs
Many financial models assume 8-10 €/kWp/year in OPEX, but poorly designed plants (difficult access, problematic inverters) can exceed 15 €/kWp/year.
4. Regulatory Changes
New capacity charges, grid tolls, or changes in the access regime can impact profitability. In 2025, new tolls were introduced that reduced margins by 2-3%.
8. Tools to Calculate Your ROI
Calculating ROI manually in Excel is tedious and error-prone. At PV Maps, we offer:
- ROI Simulator: Enter your data (CAPEX, OPEX, zone, financing) and get an estimated payback
- Real-time Monitoring: Compare your actual vs. estimated production to validate your projections
- Comparative Analysis: Benchmarking with similar plants in your region
Want to calculate your project’s ROI? 👉 Access the ROI simulator
9. Conclusion: Is It Worth Investing in Photovoltaics in 2026?
The short answer is: yes, but with nuances.
Favorable scenarios (4-6 year payback):
- Plants in Andalucía, Extremadura, or Castilla-La Mancha
- Optimized CAPEX (< 550 €/kWp)
- PPA signed at > 38 €/MWh or spot market access with active management
- Favorable financing (< 5% interest)
Scenarios to avoid (> 10 year payback):
- Plants in low irradiance areas without subsidies
- Nodes with high curtailment without compensation
- Inflated CAPEX due to grid connection overcosts
- Projects without rigorous technical feasibility studies
ROI for a photovoltaic plant in Spain remains competitive, but the difference between a good project and a bad project can be 3-4 years of payback. The key is to do exhaustive technical due diligence, correctly model cash flows, and monitor actual performance from day one.
Need advice for your solar investment? Contact us for a personalized analysis or explore our inventory of operating plants for benchmarking.