Solar O&M: Real Maintenance Costs of a Photovoltaic Plant per MW
Introduction
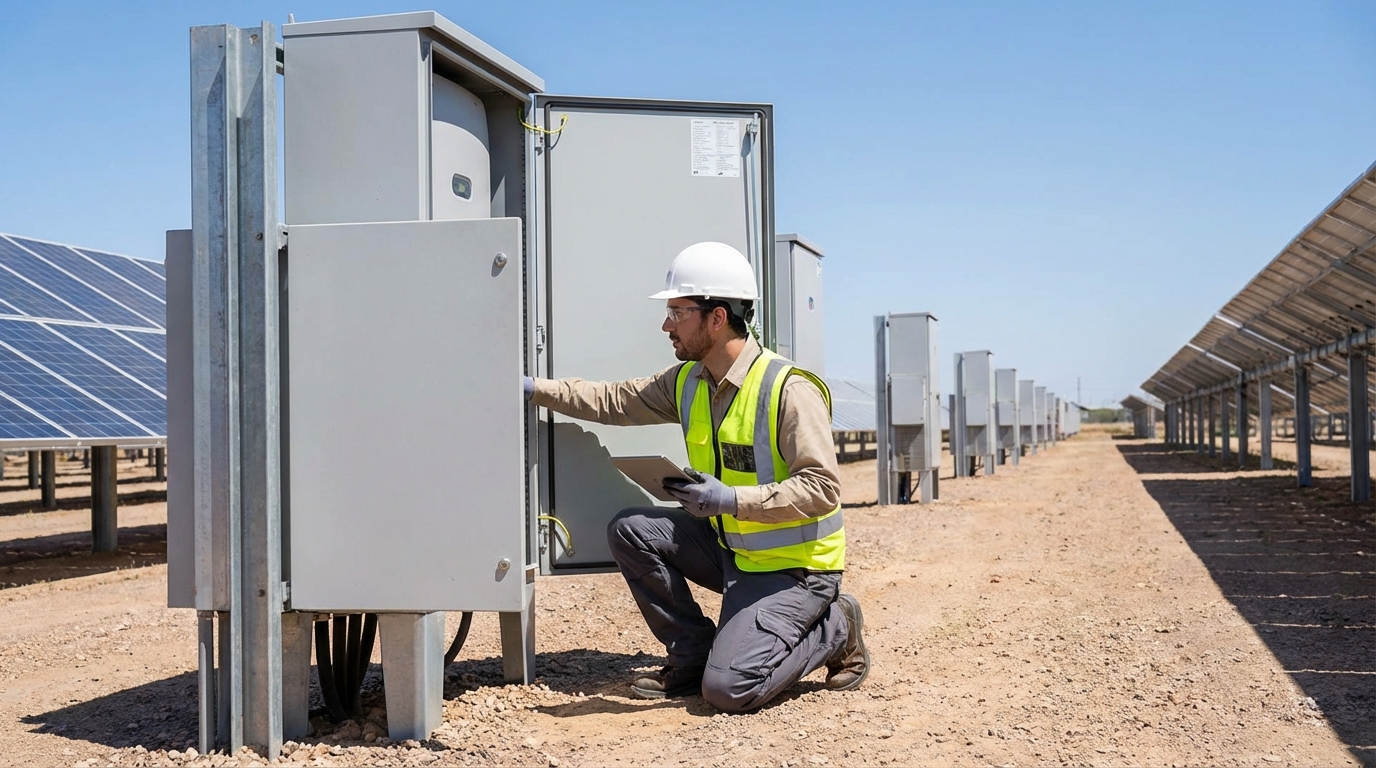
You’ve just commissioned your 20 MWp photovoltaic plant. The inverters are humming, the panels gleam under the Andalusian sun, and the first energy sales invoices are starting to arrive. Everything’s perfect… until you receive the first invoice from the O&M contract: €180,000 per year.
Is it expensive? Is it cheap? What exactly does it include? Are you paying for services you could do in-house? And most importantly: how much should you really be spending on maintenance per installed MW?
The OPEX (Operating Expenditures) of a photovoltaic plant typically represents between 1.5% and 3% of the initial CAPEX per year. For a €10M plant, this means €150,000-300,000 annually over 25-30 years. If you don’t optimize these costs, you could be leaving €1-2 million in net present value on the table.
In this article, we’ll break down line by line the real O&M costs of photovoltaic plants in Spain in 2026, compare full-service contracts vs separate services, and give you the keys to reduce your OPEX without sacrificing your plant’s availability.
1. Cost Breakdown: What Does O&M Include?
The term O&M (Operation & Maintenance) groups multiple services. The typical cost structure is:
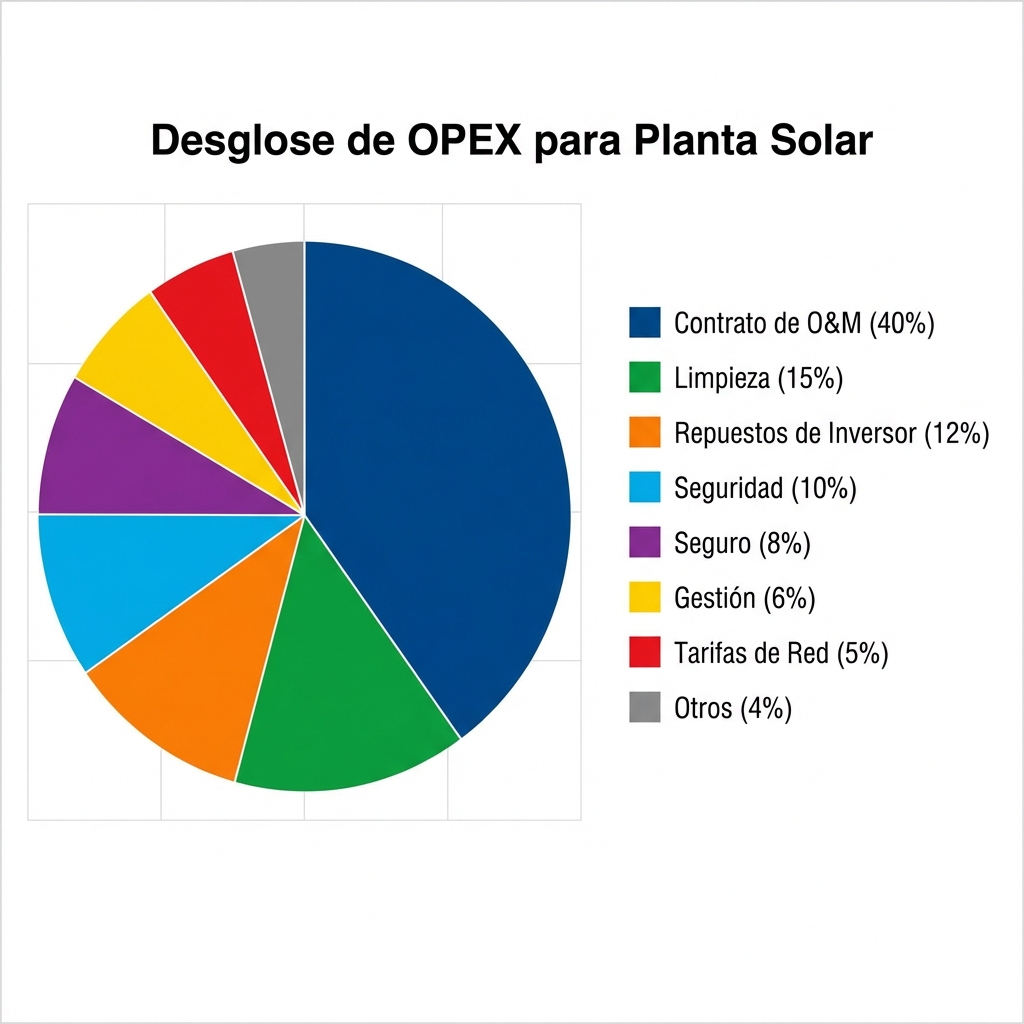
OPEX Structure in Photovoltaic Plant (10 MWp)
| Item | Annual Cost | €/kWp/year | % of Total OPEX |
|---|---|---|---|
| O&M Contract (labor) | €40,000 | €4.00 | 40% |
| Panel cleaning | €15,000 | €1.50 | 15% |
| Inverter/SCADA spare parts | €12,000 | €1.20 | 12% |
| Surveillance/Security | €10,000 | €1.00 | 10% |
| Insurance | €8,000 | €0.80 | 8% |
| Technical/admin management | €6,000 | €0.60 | 6% |
| Grid fees/Tolls | €5,000 | €0.50 | 5% |
| Other (vegetation, access) | €4,000 | €0.40 | 4% |
| TOTAL OPEX | €100,000 | €10.00 | 100% |
Typical range in Spain (2026): €8-15/kWp/year depending on:
- Plant size (economies of scale)
- Location (accessibility, climate)
- Type of contract (full-service vs separate services)
- Equipment quality (reliable brand inverters reduce corrective costs)
2. Preventive Maintenance: The Backbone
Preventive maintenance encompasses all planned activities to prevent failures before they occur. It’s like annual car service: you prefer to change the oil on time rather than breaking down on the road.
2.1 Visual Inspections (Frequency: Monthly/Quarterly)
What’s done:
- Visual inspection of panels (breaks, delamination, hot spots)
- Structure inspection (corrosion, loose bolts)
- Cabling and junction box verification
- Fencing and signage status
Typical cost: €500-1,000/visit (10 MWp plant) Frequency: 1 visit/month → €6,000-12,000/year
⚠️ Common mistake: Reducing these visits to save costs. If a string disconnects and you don’t detect it for 3 months, you lose more in production than you save in inspections.
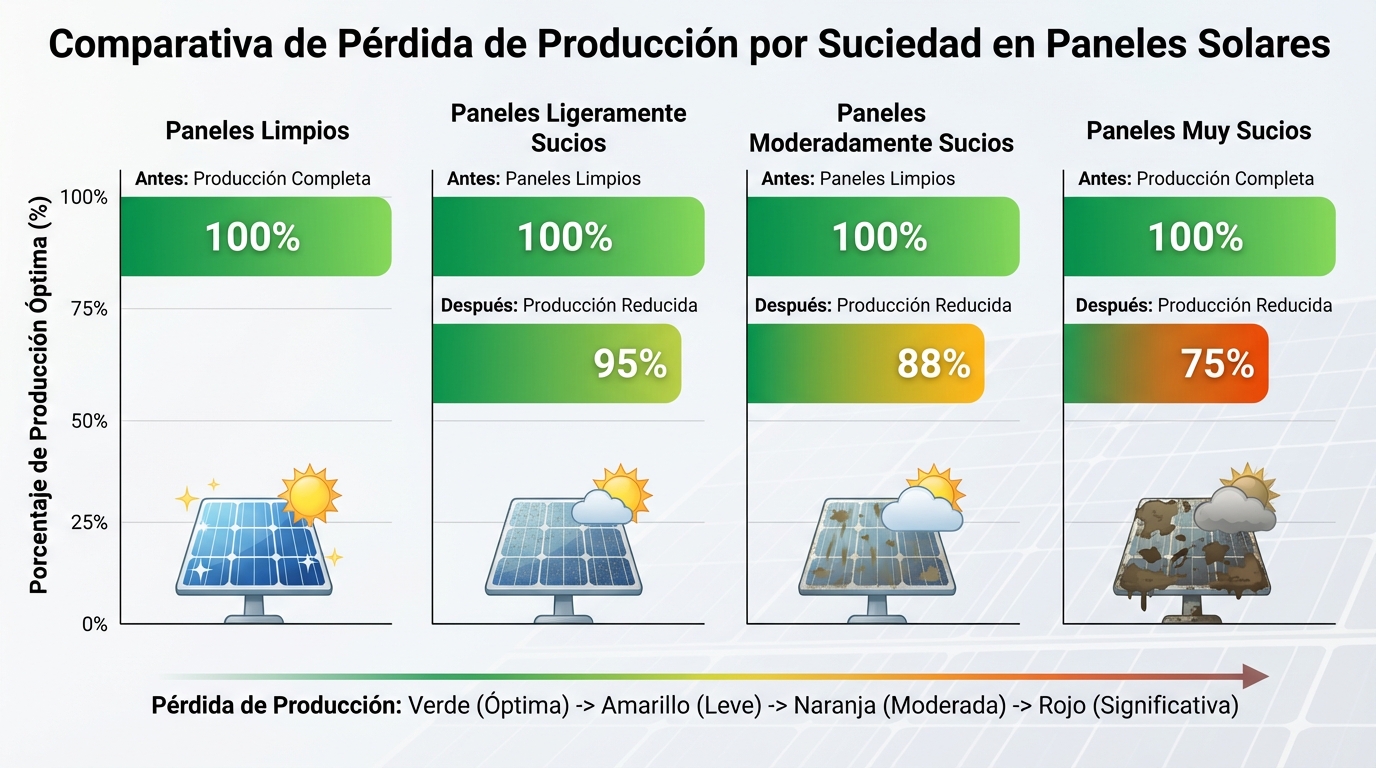
2.2 Panel Cleaning
Dirt (dust, pollen, bird droppings) can reduce production by 5-15% depending on the area.
Factors determining frequency and cost:
| Zone | Recommended Frequency | Cost per Cleaning | Annual Cost |
|---|---|---|---|
| Coastal zone (high salinity) | 4-6 times/year | €3,500 | €14,000-21,000 |
| Dry inland (Castilla, Extremadura) | 3-4 times/year | €3,500 | €10,500-14,000 |
| Northern Spain (more rainfall) | 2-3 times/year | €3,500 | €7,000-10,500 |
Cleaning methods:
- Automatic robots (high initial CAPEX, low OPEX): €50,000-100,000 investment, but reduces cost per cleaning by half
- Manual cleaning with demineralized water: More expensive, but flexible
- Waiting for rain: Free, but you lose production meanwhile (❌ not recommended in dry areas)
Cleaning ROI calculation:
- Production loss from dirt: 10% → 1,750 MWh/year (10 MWp plant with 1,750 kWh/kWp)
- Value of lost energy: 1,750 MWh × €40/MWh = €70,000
- Cleaning cost: €14,000/year
- Cleaning ROI: (70,000 - 14,000) / 14,000 = 400%
Conclusion: Cleaning almost always pays for itself.
2.3 Inverter Maintenance
Inverters are the “weak link” of a photovoltaic plant. Their typical lifespan is 10-15 years (vs 25-30 years for panels).
Preventive tasks:
- Filter and fan cleaning (every 3-6 months)
- Electrical connection inspection (annual)
- Firmware updates (per manufacturer)
- Electrical parameter measurement (quarterly)
Typical cost:
- Central inverter (> 1 MW): €2,000-3,000/year per unit
- String inverter (< 100 kW): €200-400/year per unit
For 10 MWp plant with 5 × 2 MW inverters: €10,000-15,000/year
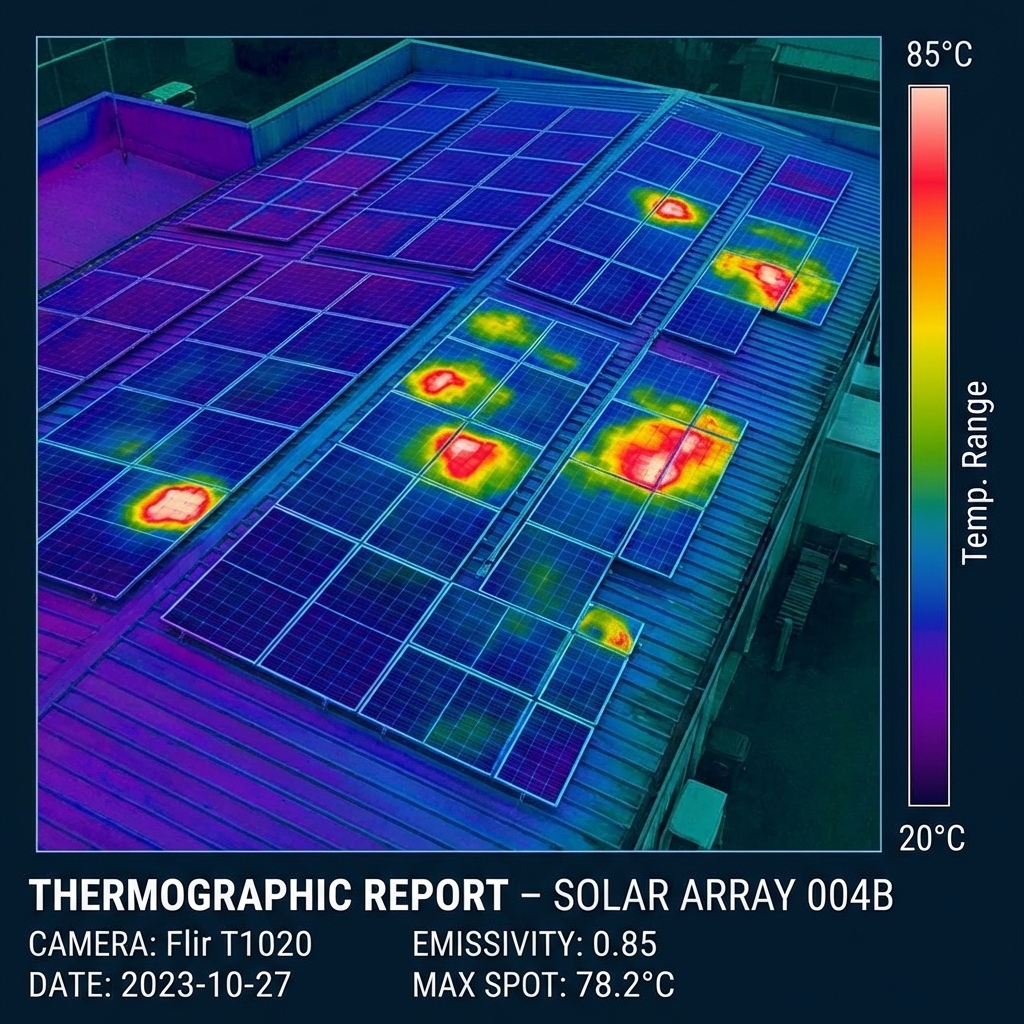
2.4 Thermographic Inspection (Annual)
An inspection with thermal drones detects:
- Hot spots (from defective cells)
- Disconnected strings
- Bypass diode failures
Cost: €2,000-4,000 per complete inspection (10 MWp plant) Frequency: 1 time/year ROI: Detecting 1-2% of defective panels before they fail can save you €20,000-30,000 in lost production
3. Corrective Maintenance: When Something Breaks
Corrective maintenance encompasses all unplanned repairs. Includes:
- Replacement of failed inverters
- Replacement of broken panels (hail, vandalism)
- Repair of disconnected strings
- Replacement of fuses, relays, electronic cards
Average Cost of Correctives
Typical range: €1-3/kWp/year in plants with quality equipment Problematic range: €5-10/kWp/year in plants with low-quality equipment or poorly designed
Examples of typical correctives:
| Failure | Frequency | Repair Cost | Lost Production |
|---|---|---|---|
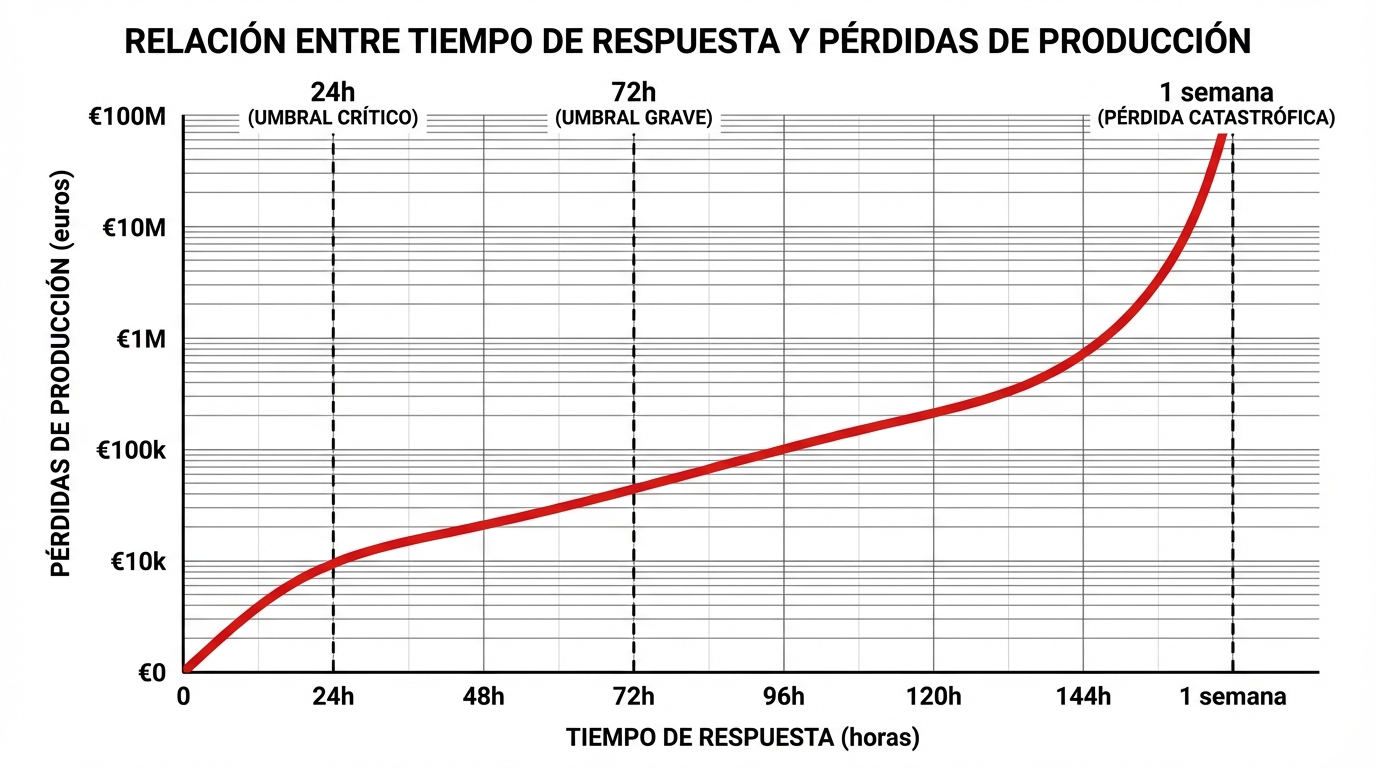
| Failed inverter | 1 every 5 years/inv | €15,000-30,000 (replacement) | €50,000-100,000 if it takes 2 months |
| Disconnected string | 2-3 per year | €500-1,500 | €2,000-5,000 |
| Broken panel | 0.1-0.5% annual | €200-300/panel | Marginal |
| SCADA failure | 1 every 2 years | €2,000-5,000 | Hard to quantify (you lose visibility) |
Mitigation strategy:
- Critical spare parts stock (backup inverters, fuses, cards): €20,000-50,000 initial CAPEX, but reduces downtime from 4 weeks to 2 days
- Extended warranty contracts with manufacturers: Adds €0.5-1/kWp/year, but reduces risk of major correctives
- 24/7 monitoring: Detecting failures in hours vs days can reduce production losses by 80%
4. O&M Contracts: Full-Service vs À la Carte
You have two main options for managing O&M:
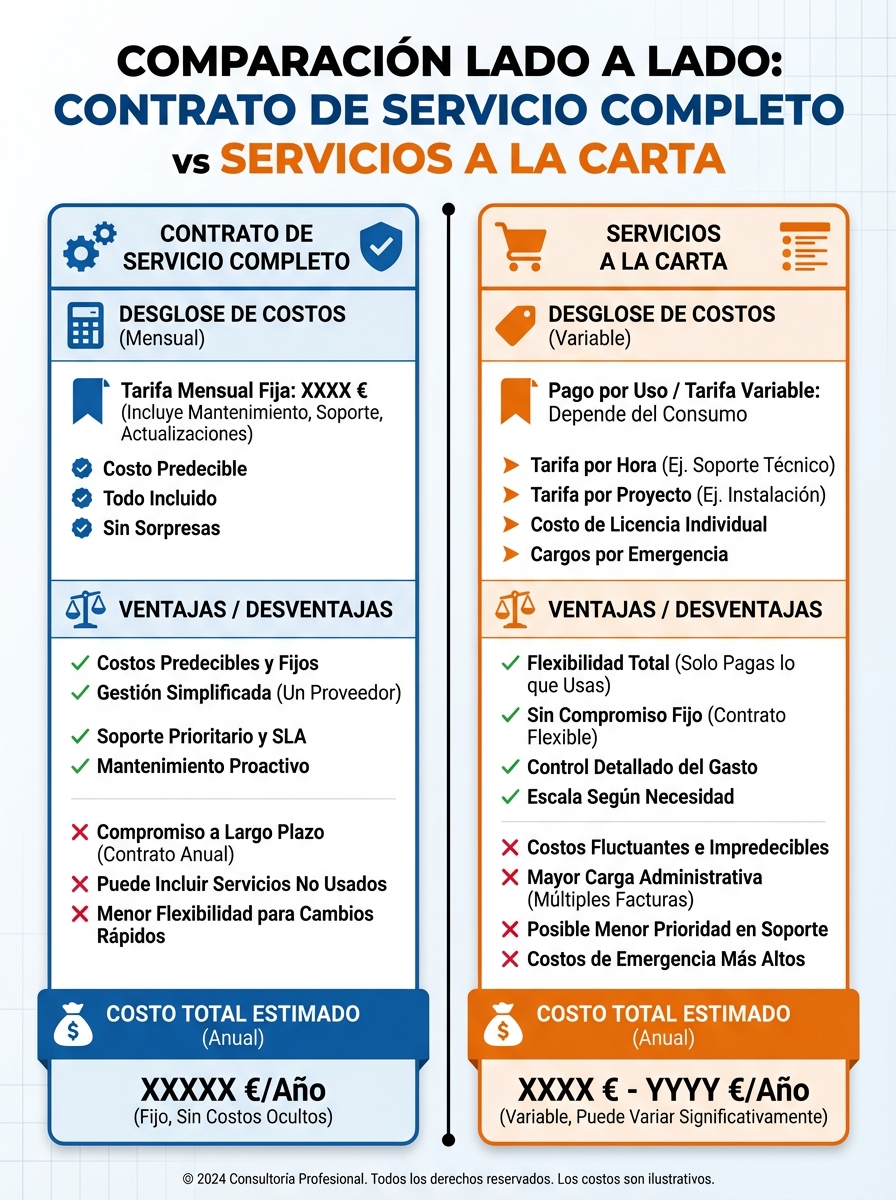
Option A: Full-Service Contract
What’s included:
- All preventive and corrective maintenance
- Spare parts (sometimes with limits)
- Technical staff available 24/7
- Warranty management with manufacturers
- Monthly reporting of production and KPIs
Typical cost: €8-12/kWp/year (all-inclusive minus insurance and tolls)
Advantages:
- ✅ Simplicity: one contract, one contact
- ✅ Risk transferred: O&M assumes risk of major correctives
- ✅ Financiability: banks prefer full-service contracts with solvent companies
Disadvantages:
- ❌ Less control: you depend on their planning
- ❌ Potentially more expensive if your plant is very reliable
- ❌ Availability clauses sometimes lax (95% availability sounds good, but it’s 18 days of downtime per year)
Option B: Separate Services (À la Carte)
Structure:
- Contract cleaning with specialized company (€1.5/kWp/year)
- Contract inspections with engineering (€1/kWp/year)
- Correctives on demand (pay-per-incident)
- In-house technical management (1 part-time technician)
Typical cost: €6-9/kWp/year (if well managed)
Advantages:
- ✅ Potential savings of 20-30%
- ✅ More control over quality and frequency
- ✅ You can optimize each service
Disadvantages:
- ❌ Greater management complexity (multiple contracts)
- ❌ Risk of large unbudgeted correctives
- ❌ Requires competent internal technical team
Recommendation:
- Plants > 50 MWp with own technical team: À la carte
- Plants 10-50 MWp with external asset manager: Full-service
- Portfolio of multiple plants: Full-service with volume negotiation
5. Warranty Management: The Art of Not Leaving Money on the Table
Solar panels typically come with two warranties:
- Product warranty (10-15 years): Covers manufacturing defects
- Performance warranty (25-30 years): Guarantees the panel won’t degrade more than X% per year
Common mistake: Not claiming when panels don’t meet performance warranty.
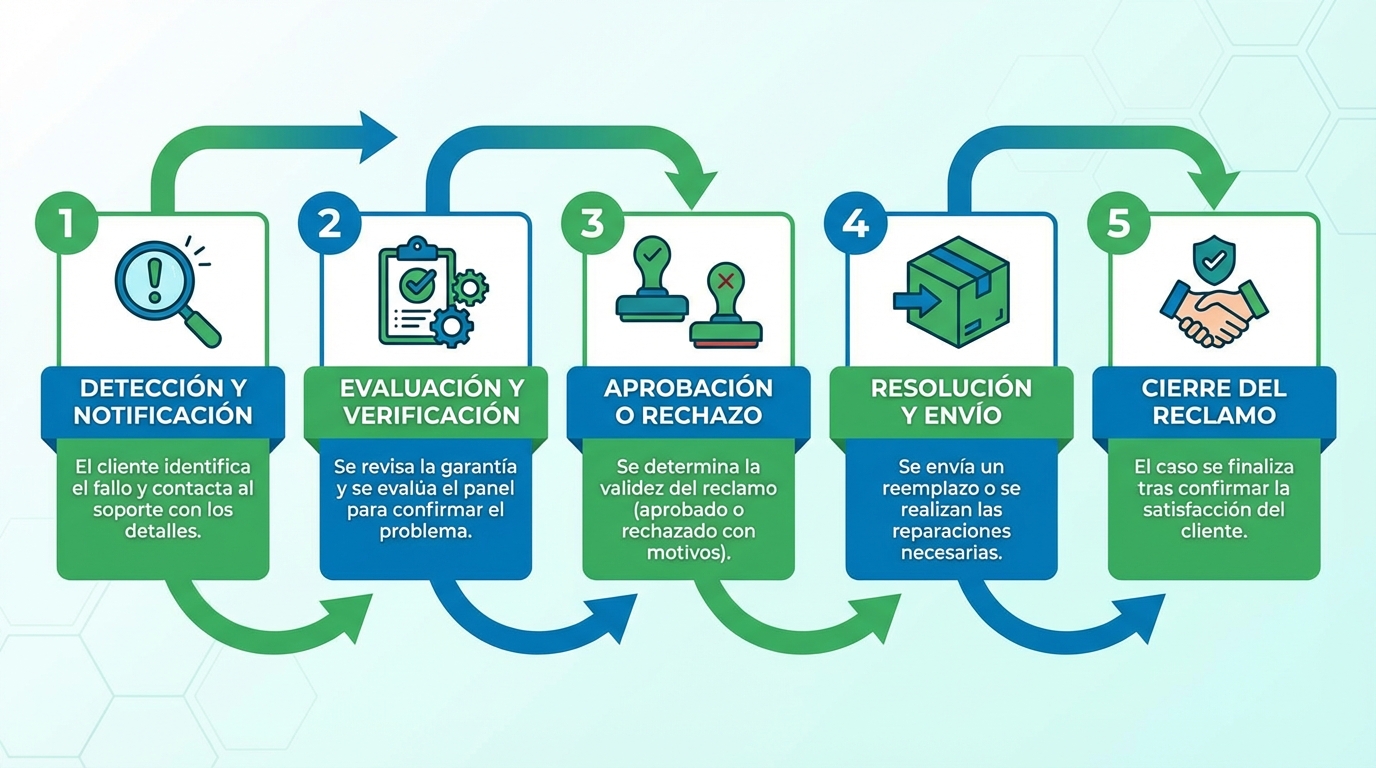
How to Manage Warranties Efficiently
Step 1: Rigorous Measurement
- Use I-V curves to measure real degradation (not just total production, which depends on irradiance)
- Perform annual measurements with calibrated equipment
- Cost: €3,000-5,000 per complete measurement of 10 MWp plant
Step 2: Documentation
- If you detect degradation > warranty (e.g., -1.5%/year when they guarantee -0.7%/year), document:
- I-V curves of representative panel sample
- Irradiance and temperature data
- Maintenance history (to prove it’s not from lack of cleaning)
Step 3: Claim
- Send formal claim to manufacturer
- Negotiate: panel replacement? Economic compensation?
- Critical timing: Don’t wait until year 10 to claim year 5 degradation
Real case: 30 MWp plant detected in year 3 that 15% of panels had 2.5%/year degradation (warranty: 0.7%/year).
- Claim: 4,500 defective panels
- Value of lost production: ~€200,000 (present value)
- Resolution: Manufacturer replaced 4,500 panels (cost to them: €1.2M)
- Cost of claim process: €15,000 (independent engineer + legal)
- ROI: 1,300%
Recommendation: Include in your O&M contract proactive warranty management. Many full-service contracts include it, but verify they’re diligent.
6. Panel Cleaning: When Is It Worth It?
We already mentioned that cleaning usually pays for itself, but there are nuances:
Cost-Benefit Analysis of Cleaning
Basic formula:
Real example (10 MWp Plant in Seville):
Scenario 1: Cleaning every 4 months (3 times/year)
- Average loss from dirt: 7% (assuming cleaning before reaching 15%)
- Annual production: 17,500 MWh
- Lost production: 17,500 × 0.07 = 1,225 MWh
- Value of lost production: 1,225 × €40/MWh = €49,000
- Cleaning cost: 3 × €3,500 = €10,500
- Net benefit: €38,500
- ROI: 367%
Scenario 2: Cleaning every 6 months (2 times/year)
- Average loss from dirt: 10% (you let more dirt accumulate)
- Lost production: 17,500 × 0.10 = 1,750 MWh
- Value of lost production: €70,000
- Cleaning cost: 2 × €3,500 = €7,000
- Net benefit: €63,000
- ROI: 900%
But wait: In scenario 2, you lose an additional 525 MWh (1,750 - 1,225) = €21,000 more in losses. Scenario 2 saves €3,500 in cleaning, but loses €21,000 in production → Wrong decision
Conclusion: In dry areas, cleaning every 3-4 months is optimal. In areas with more rain, every 6 months may be sufficient.
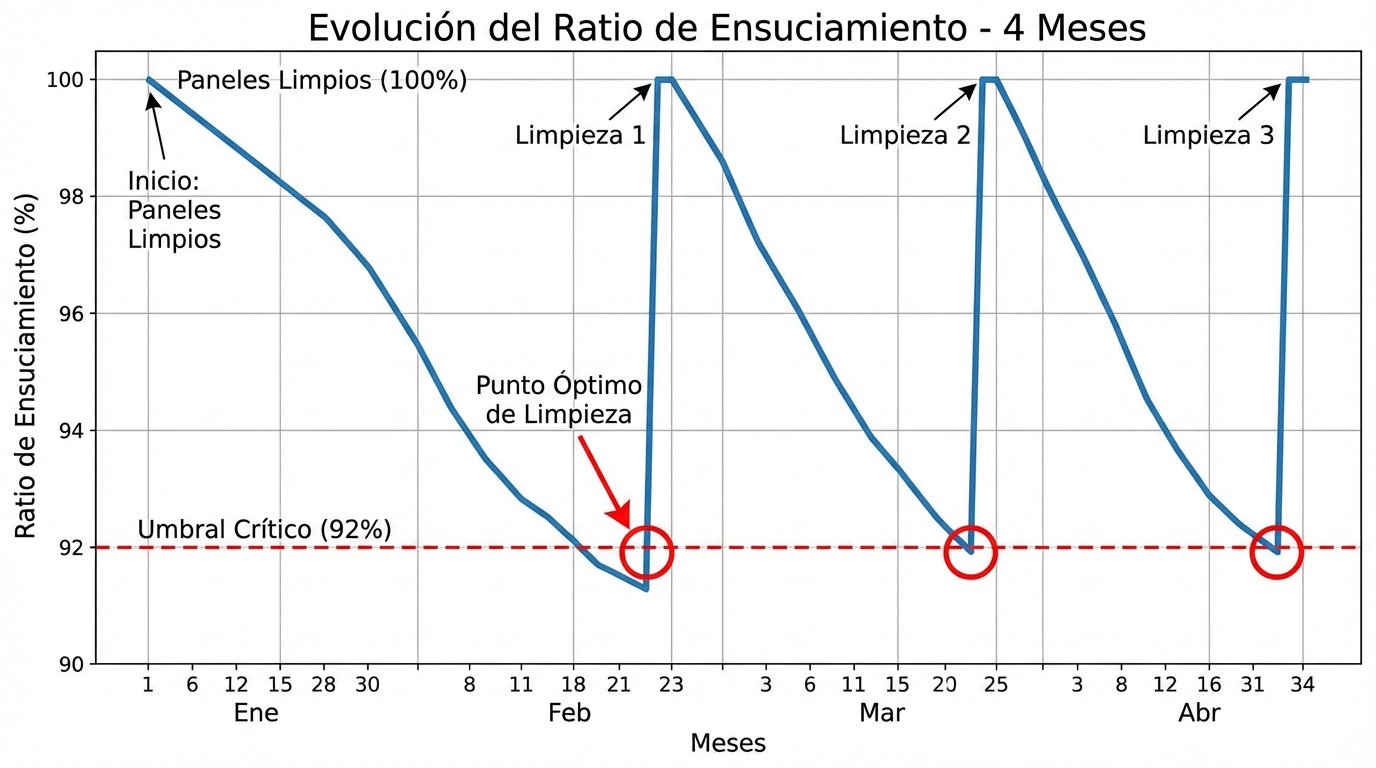
Monitoring to Optimize Cleaning
Instead of cleaning by calendar, some plants monitor the Soiling Ratio:
- Install 2-3 permanently clean reference panels
- Compare production of clean vs dirty panels
- When the difference exceeds 7-8%, schedule cleaning
Cost of soiling monitoring system: €5,000-10,000 (initial CAPEX) Benefit: Optimize cleaning frequency, can save 1-2 cleanings/year without losing production
7. OPEX Optimization: How to Reduce Costs Without Sacrificing Availability
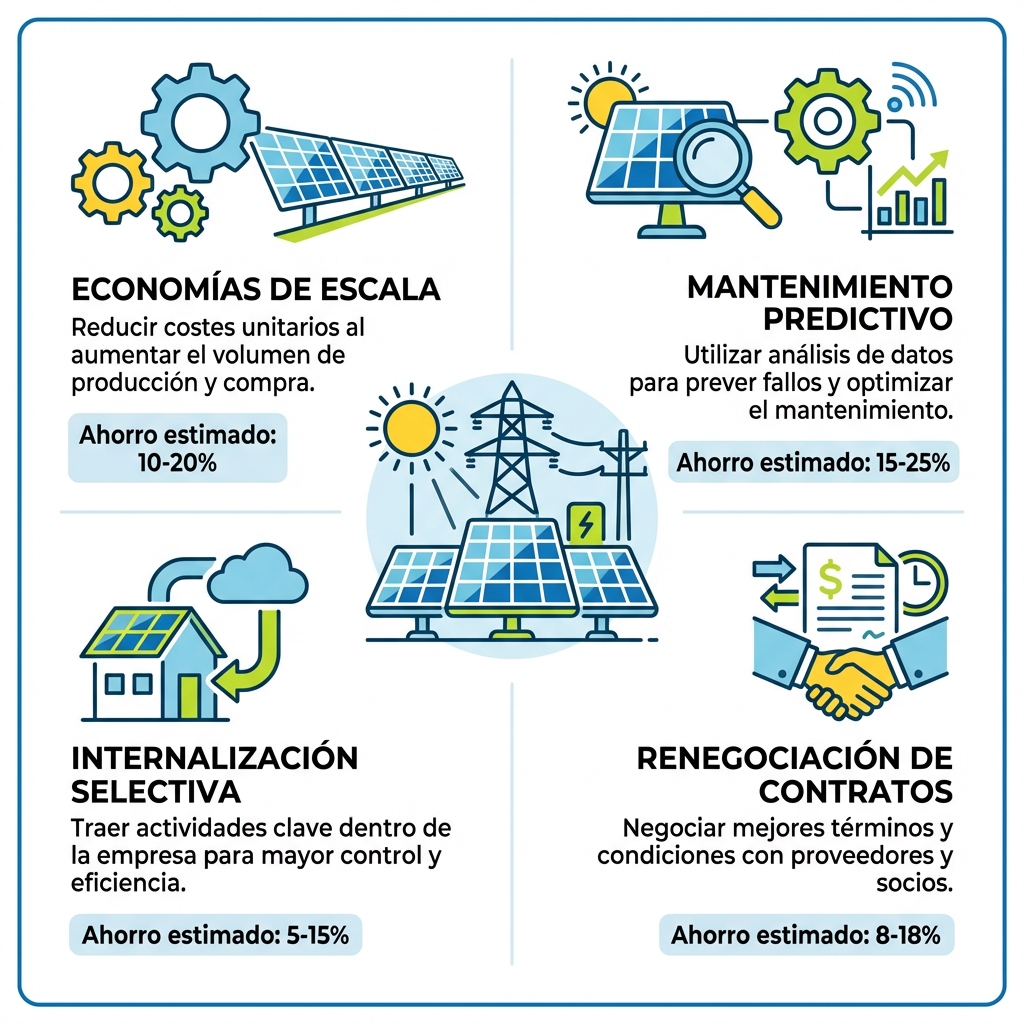
Strategy 1: Economies of Scale (Portfolio Management)
If you manage multiple plants, bundle contracts:
- 1 plant of 10 MWp: O&M at €10/kWp/year = €100,000
- 5 plants of 10 MWp: O&M at €7/kWp/year = €350,000 (savings of €150,000/year)
O&M providers offer 20-30% discounts for volume.
Strategy 2: Predictive Maintenance
Use SCADA data + machine learning to predict failures before they occur:
- Algorithm detects: Abnormal production degradation in inverter 3
- Action: Specific inspection reveals dirty fans → cleaning (€500)
- You avoid: Inverter failure 2 months later → replacement (€30,000) + lost production (€60,000)
Cost of predictive maintenance platform: €2,000-5,000/year Typical ROI: 300-500% (avoid 1-2 major correctives per year)
Strategy 3: Selective Internalization
For portfolio > 100 MWp, consider having own technical team:
- 1 internal O&M technician (salary + vehicle): €50,000/year
- Can manage: 50-100 MWp (if plants are relatively close)
- Savings vs hiring full-service: €200,000-400,000/year (depending on portfolio)
Breakeven: Portfolio > 50 MWp in same region → worth having own technician
Strategy 4: Contract Renegotiation
O&M contracts aren’t eternal. Every 3-5 years:
- Benchmark market prices (they’re falling with sector maturation)
- Renegotiate with your current provider or go to tender
- Real example: Asset manager renegotiating contracts for 10 plants went from €10/kWp/year to €7/kWp/year → savings of €600,000/year
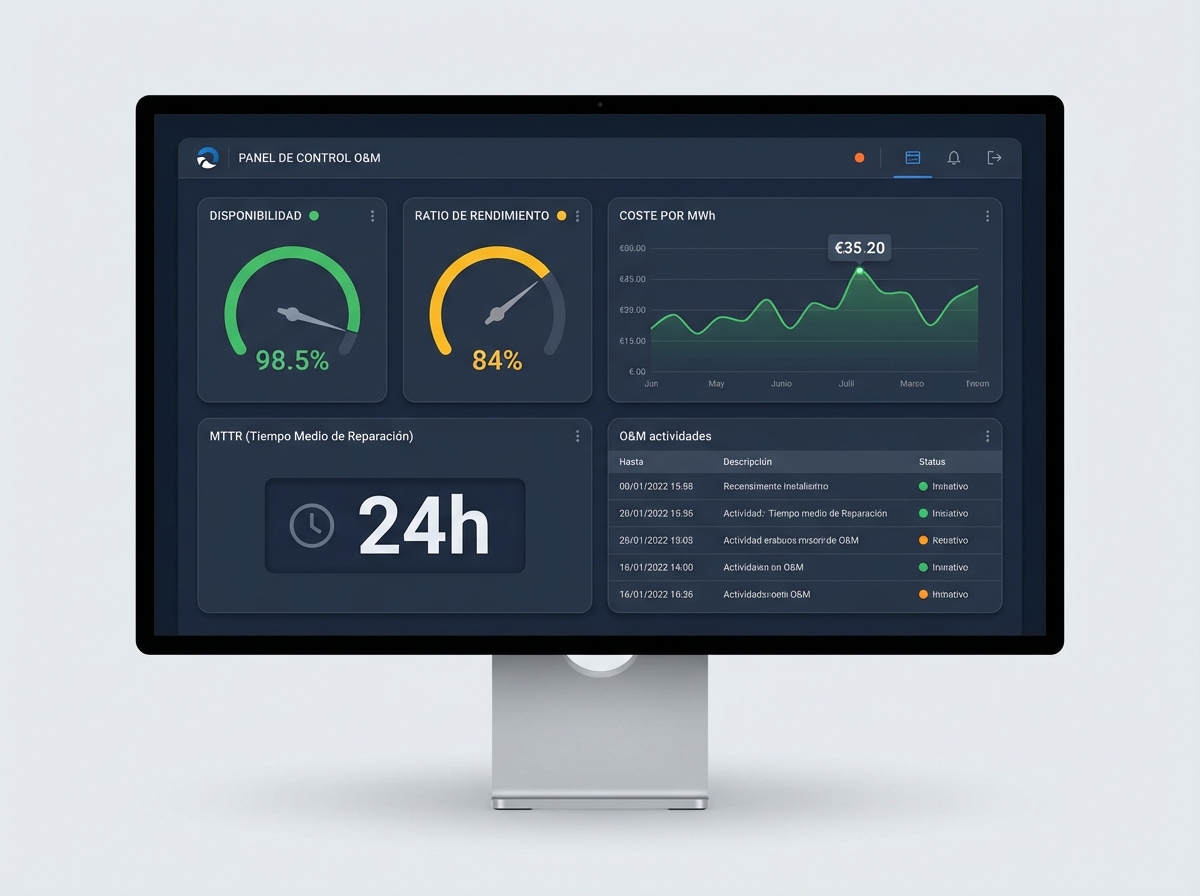
8. O&M KPIs: How to Measure If You’re Doing Well
It’s not enough to control cost. You must measure the value you receive for that cost:
| KPI | Formula | Excellent Benchmark | Acceptable Benchmark |
|---|---|---|---|
| Availability | (Operating hours / Total hours) × 100 | > 99% | > 97% |
| Performance Ratio (PR) | Real energy / Theoretical energy | > 85% | > 80% |
| MTTR (Mean Time To Repair) | Average repair time | < 24h | < 72h |
| Cost per MWh produced | Annual OPEX / Annual production | < €6/MWh | < €8/MWh |
| Corrective rate | No. correctives / MWp / year | < 2 | < 5 |
Example of bad O&M:
- OPEX: €8/kWp/year (apparently competitive)
- But: 94% availability → you lose 6% production = 1,050 MWh/year = €42,000
- Real cost: €100,000 (OPEX) + €42,000 (lost production) = €142,000 → equivalent to €14.2/kWp/year
Conclusion: More expensive O&M that maintains > 99% availability can be more profitable than cheap one with 94% availability.
9. Real Cases: Cost Benchmarking
Data from real plants monitored in PV Maps (2025):
Case A: 50 MWp Plant, Badajoz (Full-Service Contract)
- Total OPEX: €450,000/year = €9/kWp/year
- Availability: 98.5%
- PR: 83%
- Correctives: 1-2 per year
- Assessment: Medium-high cost, but excellent availability
Case B: 15 MWp Plant, Seville (Separate Services)
- Total OPEX: €105,000/year = €7/kWp/year
- Availability: 97.2%
- PR: 81%
- Correctives: 3-4 per year
- Assessment: Optimized cost, acceptable availability, but lose ~€20,000/year from lower availability
Case C: 100 MWp Portfolio, multiple locations (Internal team + subcontracts)
- Total OPEX: €700,000/year = €7/kWp/year
- Average availability: 98.8%
- Average PR: 84%
- Assessment: Optimal model for large portfolio
Benchmarking conclusion: Cost per kWp is important, but availability × PR determines real profitability.
10. PV Maps Tools for O&M Management
At PV Maps we offer tools to optimize your OPEX:
- Real-time monitoring: Automatic alerts for abnormal production → reduces MTTR
- OPEX benchmarking: Compare your costs with similar plants in your region
- Cleaning ROI calculator: Simulate when to clean based on soiling ratio
- Warranty management: Automatic tracking of degradation vs manufacturer warranties
Want to optimize your plant’s O&M? 👉 Access the OPEX management module
Conclusion: O&M Is Not an Expense, It’s an Investment
One euro saved intelligently in O&M can generate five euros in additional production value. But one euro saved foolishly (reducing inspections, delaying cleaning, ignoring warranties) can cost you fifty euros in lost production.
Keys to efficient O&M:
- Preventive over corrective: Every euro in preventive saves three in corrective
- Optimized cleaning: Not by calendar, but by real soiling ratio
- Proactive warranty management: Don’t leave €200,000 in unclaimed warranties
- Rigorous measurement: Availability > 98% and PR > 82% should be your minimum requirements
- Periodic renegotiation: Market prices are falling, your contracts should too
The Spanish solar O&M market has matured enormously. Prices have fallen 30% since 2020, but service quality has improved. Take advantage of this competition to demand more for less, but never sacrifice availability to save €1-2/kWp/year. Your plant is designed to produce for 25 years: every day down is a day you’ll never recover.
Need help negotiating your O&M contract? Contact us