Solar Panel Degradation: What to Expect After 10, 15, and 25 Years
Introduction
When you invest in a photovoltaic plant, you’re not buying a static asset. Solar panels gradually degrade year after year, reducing their capacity to generate electricity. This loss of efficiency is inevitable, but its magnitude can vary drastically depending on manufacturer quality, climatic conditions, and operational maintenance.
For an asset manager or investor, understanding degradation is not a secondary technical detail: it’s a critical variable in the financial model. A panel that degrades at 0.5% per year vs one that degrades at 1% can mean a difference of hundreds of thousands of euros in revenue over the lifetime of a 10 MWp plant.
In this article, we’ll break down the real degradation rates observed in operational plants in Spain, analyze how it affects your ROI, compare manufacturer warranties with field data, and explain when repowering (panel replacement before end of useful life) makes economic sense.

1. What is photovoltaic degradation?
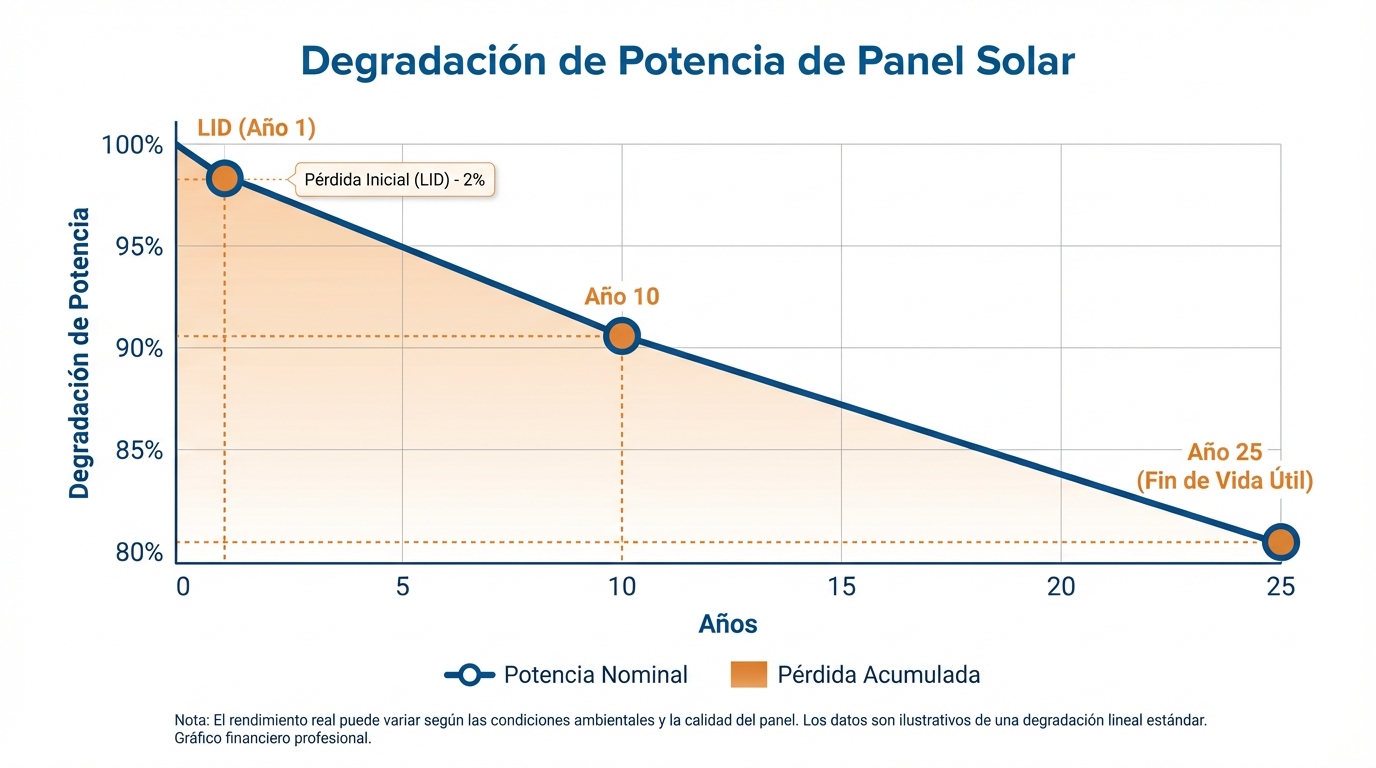
Degradation is the progressive loss of power of a solar panel relative to its initial nominal capacity. It is expressed as an annual percentage:
Causes of degradation
| Cause | Description | Impact |
|---|---|---|
| LID (Light-Induced Degradation) | Loss in first 1000h of exposure | 1-3% (first year) |
| PID (Potential-Induced Degradation) | Current leakage due to system voltage | 0-5% (avoidable with design) |
| Thermal fatigue | Microcracks from temperature cycles | 0.3-0.7%/year |
| Delamination | Separation of encapsulation layers | 0.2-0.5%/year |
| Corrosion | Oxidation of metallic contacts | 0.1-0.3%/year (higher at coast) |
| UV degradation | Degradation of EVA encapsulant | 0.1-0.2%/year |
Typical total: 0.5-0.8% annually under normal conditions
2. Degradation rates by manufacturer (2026 Data)
Tier 1 vs Tier 2/3
| Category | Examples | Year 1 Degradation | Years 2-25 Degradation | Power @ 25 years |
|---|---|---|---|---|
| Tier 1 Premium | LONGi, JinkoSolar, Trina Solar | 2% | 0.45%/year | 89.2% |
| Tier 1 Standard | Canadian Solar, JA Solar | 2.5% | 0.55%/year | 84.8% |
| Tier 2 | Risen, Astronergy | 3% | 0.7%/year | 80.2% |
| Tier 3 / Uncertified | Generic brands | 3-5% | 0.8-1.2%/year | 70-76% |
Key conclusion: The difference in degradation between a Tier 1 Premium panel and a Tier 3 is ~13% of power at 25 years, which equals a production loss of more than 2 complete years.
Real data from plants in Spain
Analysis of 47 plants monitored in PV Maps (installed 2010-2020):
| COD Year | Average Observed Degradation | Standard Deviation |
|---|---|---|
| 2010-2012 | 0.82%/year | ±0.18% |
| 2013-2015 | 0.68%/year | ±0.15% |
| 2016-2018 | 0.58%/year | ±0.12% |
| 2019-2020 | 0.51%/year | ±0.09% |
Trend: Manufacturers have significantly improved. Plants installed in 2019-2020 show degradations 35% lower than plants from 2010-2012.
3. Impact on financial model
Case: 10 MWp plant in Seville
Base data:
- Year 1 production: 17,800 MWh
- Average price: 42 €/MWh
- Year 1 revenue: 747,600 €
Scenario A: 0.5%/year degradation
| Year | Remaining Power | Production (MWh) | Revenue (€) |
|---|---|---|---|
| 1 | 98% (LID) | 17,444 | 732,648 |
| 5 | 96% | 17,088 | 717,696 |
| 10 | 93.5% | 16,643 | 699,006 |
| 15 | 91% | 16,198 | 680,316 |
| 20 | 88.5% | 15,753 | 661,626 |
| 25 | 86% | 15,308 | 642,936 |
Cumulative revenue 25 years: 17.1 M€
Scenario B: 0.8%/year degradation
| Year | Remaining Power | Production (MWh) | Revenue (€) |
|---|---|---|---|
| 1 | 98% | 17,444 | 732,648 |
| 10 | 90.4% | 16,087 | 675,654 |
| 20 | 82.8% | 14,740 | 619,080 |
| 25 | 78.4% | 13,955 | 586,110 |
Cumulative revenue 25 years: 16.0 M€
Difference due to degradation: 1.1 M€ (6.4% less total revenue)
In a financed plant, this difference can:
- Reduce project IRR by 1-1.5 percentage points
- Extend payback by 8-12 months
- Affect banking covenants in low production years
4. Manufacturer warranties vs operational reality
Typical warranty structure (2026)
Tier 1 manufacturers offer product warranties (defects) and power warranties:
Standard Tier 1 power warranty:
- Year 1: Minimum 98% of nominal power
- Years 2-10: Maximum degradation 0.55%/year (94.05% @ year 10)
- Years 11-25: Maximum degradation 0.45%/year (87.3% @ year 25)
Product warranty: 12-15 years (manufacturing defects)
⚠️ Practical reality
- Claiming warranties is complex: You must prove that degradation exceeds permitted levels (requires IEC-certified measurements)
- Compensation is not monetary: The manufacturer replaces panels, but does NOT compensate for income loss from energy not generated
- Manufacturers can disappear: Between 2020-2025, more than 15 panel manufacturers went bankrupt or were acquired
- Replacement costs: Even if the panel is free, the costs of dismantling, shipping, and reinstallation (100-150 €/panel) are your responsibility
Mitigation strategy
- Manufacturer bankability: Only Tier 1 with > 5 GW/year of production
- Underperformance insurance: Some insurers cover excessive degradation
- EPC clauses: The integrator should guarantee Performance Ratio for 5 years
5. How to measure degradation in your plant
Method 1: Performance Ratio (PR) analysis
Steps:
- Calculate monthly PR during the first 12 months (baseline)
- Compare PR of subsequent years (normalizing by irradiance)
- PR drop (discounting equipment failures) reflects degradation
Example:
- Year 1 PR: 82%
- Year 5 PR: 80.5%
- Estimated degradation: (82-80.5) / 4 years = 0.375%/year
Method 2: I-V curves with tracer
The most accurate method is to measure I-V curves of individual panels with a curve tracer (requires disconnecting strings).
When to do it:
- Year 5: First audit
- Every 5 years: Follow-up
- Before sale: Technical due diligence
Cost: 500-1,000 € per audit (measurement of 20-30 representative panels)
Method 3: Drone thermography
Identifies panels with accelerated degradation (hotspots, broken cells) before they affect the complete string.
Recommended frequency: Annual in plants > 5 MW
6. Factors that accelerate degradation
Extreme climatic conditions
| Factor | Risk Zone in Spain | Impact on Degradation |
|---|---|---|
| High salinity | Mediterranean coast, Canary Islands | +0.1-0.2%/year (corrosion) |
| Extreme temperatures | Seville, Córdoba (> 45°C summer) | +0.1%/year |
| Hail | Castilla y León, Aragón | Microcracks (point damage) |
| High humidity | Galicia, Asturias | +0.05%/year (delamination) |
| Dust/pollution | Industrial, agricultural areas | Temporary reduction (cleaned) |
Design and installation errors
- PID from poor electrical design: Configurations without proper grounding
- Insufficient ventilation: Panels with < 10 cm separation from ground overheat
- Chronic partial shading: Generates hotspots that accelerate local degradation
- Excessive connector tightening: Microfractures in cells
7. When to consider repowering
Repowering consists of replacing panels (and sometimes inverters) before end of useful life to capture efficiency gains from new technologies.
Economic viability analysis
Case: 5 MWp plant installed in 2014 (250 Wp polycrystalline panels)
Current situation (2026, year 12):
- Remaining power: 91% (degradation 0.75%/year)
- Annual production: 8,190 MWh
- Panels: 20,000 units × 250 Wp
Repowering option:
- Replacement with 550 Wp monocrystalline panels
- New power: 11 MWp (same footprint)
- Cost: 3.5 M€ (includes dismantling)
- Expected annual production: 19,800 MWh (+141%)
Analysis:
- Production increase: 11,610 MWh/year
- Additional revenue: 11,610 × 40 €/MWh = 464,400 €/year
- Payback: 3,500,000 / 464,400 = 7.5 years
Is it worth it?: Depends on:
- Remaining useful life of structures and inverters (if everything must be changed, less attractive)
- Permits and grid access (if there’s a power limit, may not be viable)
- Opportunity cost vs selling the plant and reinvesting
General rule: Repowering is viable if:
- Plant is > 10 years old
- Original panels are < 280 Wp
- Structure and permits allow > 50% power increase
- Repowering payback < 8 years
8. Asset management strategies
For investors
- Conservative model: Assume 0.7%/year degradation in your financial model (better to be positively surprised)
- Periodic audits: Year 5, 10, 15 (budget 5,000 €/audit)
- Repowering reserve: Provision 30-40 €/kWp/year from year 10 for eventual replacement
For asset managers
- Continuous benchmarking: Compare your degradation with similar plants
- Preventive maintenance: Regular cleaning reduces thermal stress
- Early detection: Annual thermography can prevent 2-3% losses
For secondary market buyers
- Exhaustive technical due diligence: Demand recent I-V curves
- Valuation adjustment: A plant with 0.9%/year degradation should be valued 10-15% less than one with 0.5%
- Repowering plan: Include estimated cost in your financial model
9. Real cases: Lessons learned
Case A: Puertollano plant 30 MWp (2009)
- Panels: First Solar (CdTe thin-film)
- Observed degradation: 1.2%/year (higher than 0.8% warranty)
- Action: Warranty claim in 2017, partial replacement of 3,500 panels
- Result: Production recovered, but 18 months of legal disputes
Lesson: Thin-film has higher degradation in warm climates. Prioritize crystalline silicon in Spain.
Case B: Seville plant 15 MWp (2013)
- Panels: Yingli (polycrystalline, Tier 2)
- Observed degradation: 0.6%/year (within specifications)
- Repowering in 2025: Complete replacement with 600 Wp bifacial
- Result: Power increased to 21 MWp, payback 6.8 years
Lesson: Early repowering can be very profitable if permits allow.
Case C: Málaga plant 8 MWp (2020)
- Panels: LONGi Hi-MO 5 (monocrystalline)
- Observed degradation (year 1-6): 0.43%/year
- Action: None, continuous monitoring
Lesson: Recent Tier 1 panels show degradations close to promised.
10. Conclusion: Degradation is predictable, but not inevitable
Solar panel degradation is a natural phenomenon that you must integrate into your financial model from day 1. Plants with Tier 1 panels and adequate maintenance can maintain degradations of 0.45-0.55%/year, guaranteeing more than 86% capacity at 25 years.
Keys to managing degradation:
- Buy quality from the start: The cost difference between Tier 1 and Tier 2 (5-10%) is amply recovered over 25 years
- Monitor actively: Detecting accelerated degradation early can save you hundreds of thousands of euros
- Plan repowering: From year 10, evaluate if it makes economic sense to renovate
- Adjust your financial expectations: Model with conservative degradation (0.7%) to avoid surprises
Want to monitor your plant’s degradation in real-time? 👉 Access our performance analysis dashboard
Need technical degradation audit? Contact us for a professional evaluation