Technical Due Diligence in Solar Plants: Checklist for Investors
Introduction
When you’re going to acquire an operational photovoltaic plant (secondary market), the purchase price can range between 5-8 EBITDA multiples depending on country, signed PPA and age. For a 50 MWp plant, this can mean €25-40 million. A mistake in technical due diligence can cost you millions in future losses from asset overvaluation.
Technical due diligence (DD) is the audit process that validates the plant works as declared by the seller, has no hidden defects that will reduce future production, and operational contracts (O&M, insurance, PPAs) are properly structured.
In this article, we’ll break down step by step the technical DD process that every investor should perform before signing an SPA (Share Purchase Agreement), including common red flags, how to interpret independent engineer reports, and what data to request from the seller in the data room phase.
1. Due diligence process phases
Typical timeline (3-6 months)
| Phase | Duration | Key Activities |
|---|---|---|
| Phase 1: Data Room | 2-4 weeks | Initial document review |
| Phase 2: Desk-top Due Diligence | 3-4 weeks | Engineering analysis from office |
| Phase 3: Site Visit | 1-2 days | On-site plant inspection |
| Phase 4: Testing & Measurements | 1-2 weeks | Thermography, I-V curves, measurements |
| Phase 5: Report & Negotiation | 2-3 weeks | Final report and price adjustment |
Actors involved
- Buyer (you): Defines DD scope
- Independent engineer: Performs technical audit (mandatory for bank financing)
- Financial advisor: Translates technical findings to valuation impact
- Seller: Provides access and documentation
- O&M operator: Facilitates access to monitoring systems
2. Phase 1: Data Room documentation
Checklist of mandatory documents
A. Design and construction documentation
- As-built drawings (final executed design, not initial project)
- Component quality certificates (panels, inverters, transformers)
- Acceptance tests (SAT/PAT) from EPC
- Engineering studies: geotechnical, topographic, electrical
- Permits: construction license, AAI (Integrated Environmental Authorization), access and connection permit
B. Operational contracts
- O&M contract: scope, price, warranties, contractual KPIs
- PPA (if applicable): price, duration, curtailment clauses, penalties
- Insurance: coverage (all-risks, loss of profits), deductibles, exclusions
- Grid connection contract: tolls, contracted capacity
- Land lease: duration, price, renewal clauses
C. Historical operational data
- Monthly production (minimum 12 months, ideal 24-36 months)
- Availability by subsystem (panels, inverters, transformer, grid)
- Curtailment events: dates, duration, energy not delivered
- Real O&M costs (preventive + corrective)
- Warranty claims: panels, inverters (indicates recurring problems)
D. Financial data
- Real CAPEX: detailed breakdown (not just total figure)
- Historical OPEX: breakdown by category
- Existing debt: loan terms, covenants, guarantees
- Electricity billing: validation of declared revenues
🚩 Red Flag #1: Incomplete documentation
If the seller can’t provide monthly production data for the last 12 months, it’s an alarm signal. It may indicate:
- Deficient monitoring systems
- Operational problems they want to hide
- Unprofessional management
Action: Request direct access to SCADA or inverter platform.
3. Phase 2: Production and Performance Ratio analysis
Historical production validation
Objective: Confirm the plant produces what the seller declares and matches initial estimates.
Step 1: PR (Performance Ratio) calculation
\text{PR (\%)} = \frac{\text{Real Energy Generated (kWh)}}{\text{Real Irradiance (kWh/m²) \times \text{Installed Power (kWp) \times 1 \text{kW/m²}}} \times 100
PR benchmark in Spain (modern plants):
- Excellent: PR > 83%
- Good: PR 78-83%
- Acceptable: PR 75-78%
- Problematic: PR < 75%
Step 2: Comparison with modeled P50
The seller should have a P50 report (estimated production during development phase). Compare:
| Metric | Original P50 | Real Year 1 | Real Year 3 | Deviation |
|---|---|---|---|---|
| Annual production (MWh) | 18,500 | 18,200 | 17,800 | -3.8% |
| PR (%) | 82% | 81% | 79% | -2.4 pp |
Interpretation:
- Deviation < 3% → Normal (interannual variability)
- Deviation 3-5% → Requires explanation (initial underestimation?, operational problems?)
- Deviation > 5% → Serious red flag
🚩 Red Flag #2: Decreasing PR without explanation
If PR falls year over year (e.g., 82% → 80% → 77%), indicates:
- Accelerated panel degradation
- Undetected failures (bypass diodes, growing shading from vegetation)
- Reduced inverter efficiency
Action: Demand thermographic inspection and I-V curve measurement.
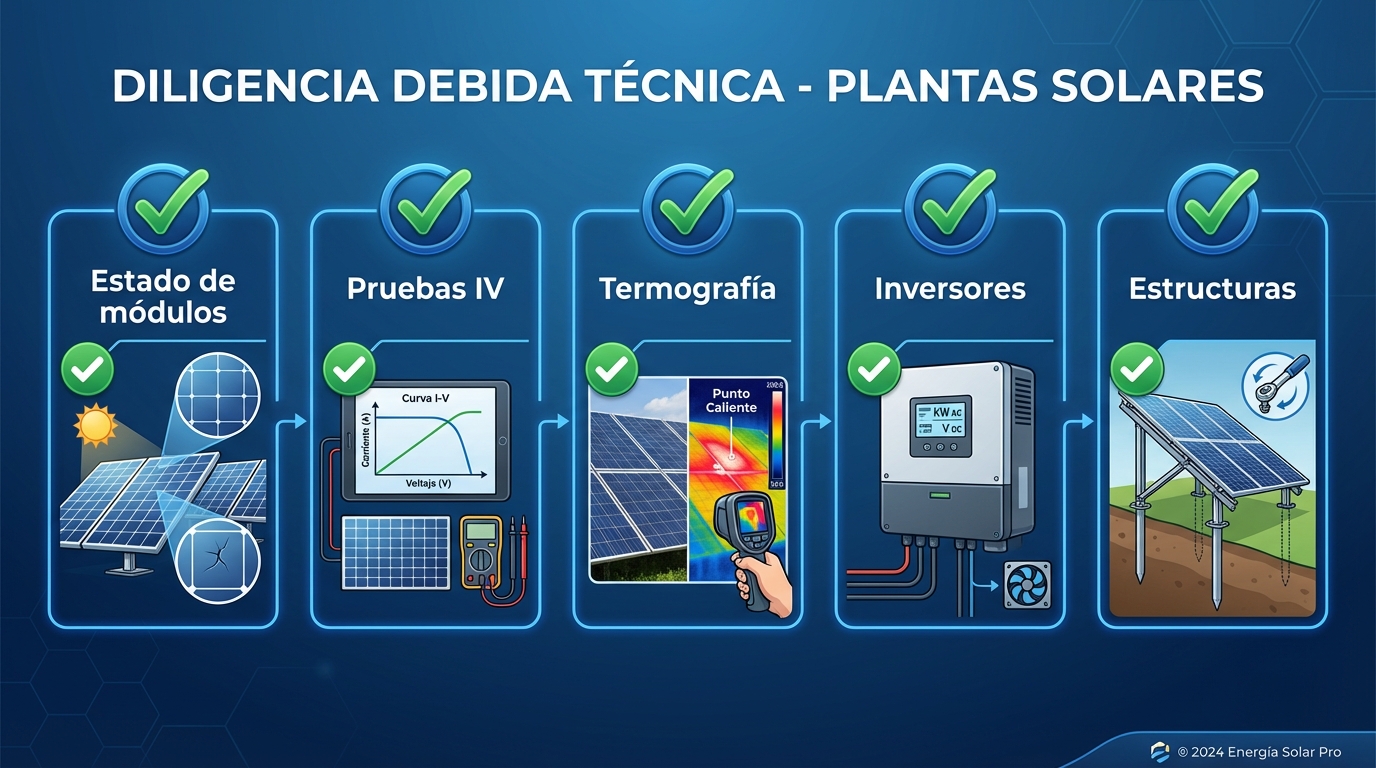
4. Phase 3: On-site inspection (Site Visit)
Visual inspection checklist
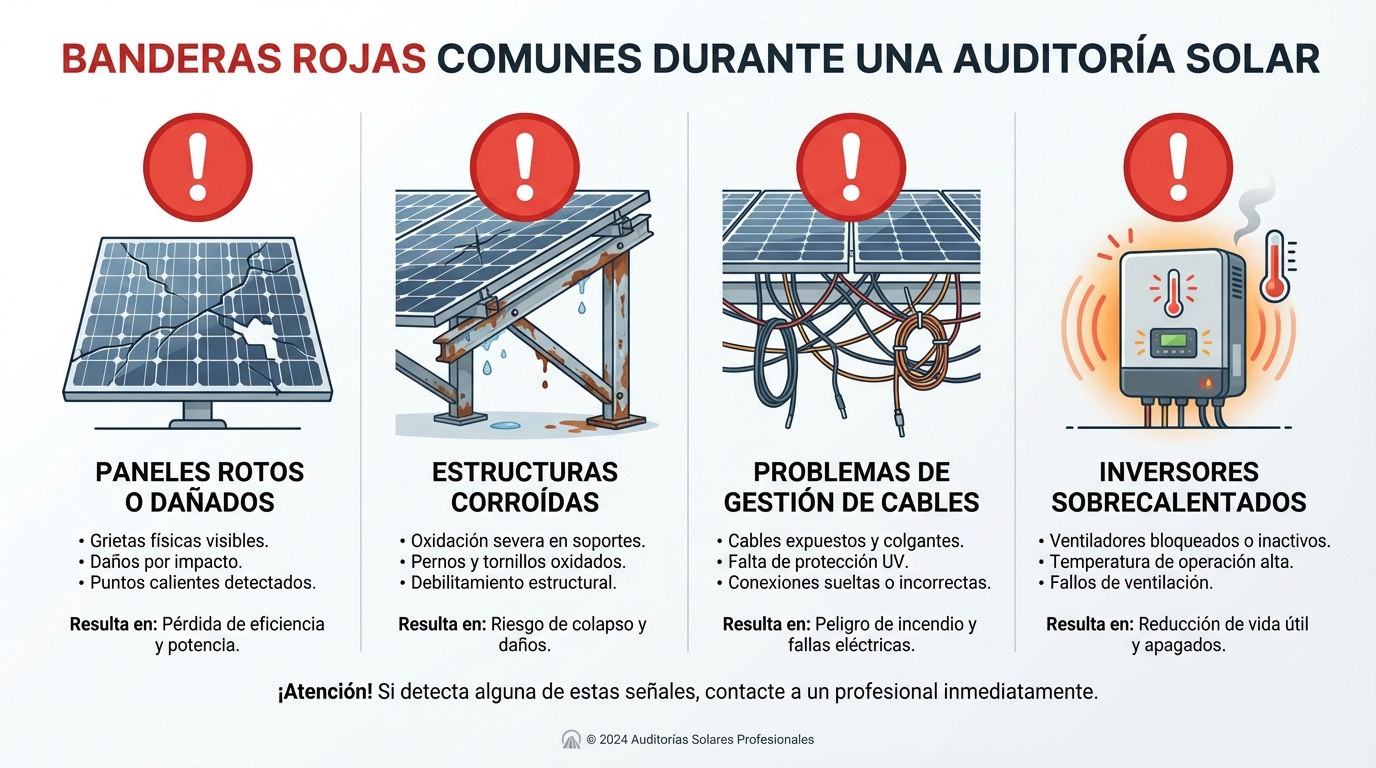
A. Panel condition
- Visible breaks: broken cells (“snail trail” appearance)
- Delamination: whitish edges, bubbles in encapsulation
- Accumulated dirt: indicates lack of maintenance
- Shadows: overgrown vegetation, poorly designed structures
- Discoloration: yellowing of encapsulant (UV degradation)
B. Structure and wiring
- Structure corrosion: especially in coastal areas
- Exposed cables: UV-degraded insulation
- MC4 connectors: corrosion, signs of arcing
- Grounding: ground continuity (measured with megohmmeter)
C. Inverters and transformers
- Operating temperature: inverters with obstructed ventilation
- Abnormal noises: transformers with irregular sound
- Error displays: note fault codes
- Cleanliness and order: dirty rooms indicate poor O&M management
D. Perimeter and access
- Fencing: condition, height (minimum 2m)
- Security cameras: functioning
- Internal roads: condition for maintenance access
- Drainage: correct functioning (prevents erosion)
🚩 Red Flag #3: Restricted access
If the seller creates obstacles to access certain areas (“that area is out of service”, “we can’t enter now”), suspect:
- Damaged equipment not repaired
- Areas with chronic low performance
Action: Demand full access or discount 5-10% of price for uncertainty.
5. Phase 4: Advanced technical testing
A. Aerial thermography by drones
What it detects:
- Panels with broken cells (hotspots)
- Blown bypass diodes
- Partial shading
- Defective connections
Typical cost: €2,000-5,000 (10-50 MW plant)
Interpretation:
- < 1% of panels with anomalies → Normal
- 1-3% → Acceptable if minor anomalies
-
3% → Demand replacement before closing or price adjustment
B. String I-V curves
Measures current-voltage of representative strings to detect degradation.
Procedure:
- Select 20-30 strings (statistical sample)
- Measure with curve tracer under standard conditions (STC)
- Compare real vs nominal power
Expected results:
- Deviation < 5% vs nominal (adjusted for degradation) → OK
- Deviation 5-10% → Requires investigation
- Deviation > 10% → Serious problem (PID, shading, failures)
C. Irradiance measurement with calibrated pyranometers
Validates that installed irradiance sensors are measuring correctly.
Why it’s important: If sensor is miscalibrated and measures 5% high, seller has been reporting artificially low PR (plant produces less than sensor indicates).
Cost: €500-1,000 (class A pyranometer rental + calibration)
D. Megger test (electrical insulation)
Measures string insulation resistance to detect current leakage (PID, damaged cables).
Expected value: > 1 MΩ between conductors and ground
Alarming value: < 0.5 MΩ (PID risk, safety loss)
6. Operational contract analysis
A. O&M Contract
Critical points to review:
| Aspect | What to Look For | Red Flag |
|---|---|---|
| Availability guarantee | > 97% | < 95% or no guarantee |
| Penalties | Clear and quantified | Vague or non-existent |
| Maintenance scope | Preventive + corrective included | Only preventive (corrective extra) |
| Duration and renewal | Min 3 years, renewable | Annual without commitment |
| Cost | €8-12/kWp/year (all-inclusive) | > €15/kWp or hidden costs |
Post-acquisition strategy:
- If O&M contract is bad, renegotiate or change it (takes 6-12 months)
- Discount from purchase price the cost of O&M transition
B. PPA (if exists)
Critical points:
-
Price and escalation:
- Fixed or indexed to CPI/market?
- Price competitive vs current market?
-
Duration and renewal:
- PPAs < 5 years: less stability
- PPAs > 15 years: higher asset valuation
-
Curtailment clauses:
- Who assumes curtailment cost?
- Is there economic compensation?
-
Off-taker solvency:
- Credit rating: minimum BBB
- Parent guarantees if subsidiary
🚩 Red Flag #4: PPA about to expire without renewal plan
If PPA expires in < 2 years and seller hasn’t negotiated renewal, asset will lose value:
- Uncertain future revenues (will depend on pool)
- Bank financing more expensive or impossible to renew
Action: Model purchase price with no-PPA scenario.
C. Insurance
Mandatory coverages:
- All-risks: equipment damage (storm, theft, fire)
- Loss of profits: compensation for extended outages
- Civil liability: third-party damages
Red flag: Policies with very high deductibles (> €50,000) that make insurance useless for common claims.
7. How to interpret the independent engineer report
Typical report structure
-
Executive Summary (5-10 pages):
- Conclusion: recommends purchase or not?
- Main findings
- Recommended valuation adjustment
-
Technical Assessment (30-50 pages):
- Design review
- Production analysis
- Testing results
- Equipment condition
-
Energy Yield Assessment:
- Future P50/P75/P90 estimate
- Comparison with original model
- Risk factors
-
Commercial & Legal Review:
- Contract analysis
- Permits and licenses
- Regulatory risks
Critical sections to review
A. Production adjustment table
Engineer will adjust expected future production based on findings:
| Adjustment | P50 Impact | Justification |
|---|---|---|
| Observed degradation (0.8% vs 0.5%) | -2.1% | Panels degrade faster |
| Unforeseen curtailment | -1.5% | Saturated node |
| Real availability (96% vs 98%) | -1.2% | Failure history |
| Total adjustment | -4.8% |
Financial impact:
- Plant valued at €25M with original P50
- Adjusted P50 (-4.8%) → Revised valuation: €23.8M
- Price adjustment: -€1.2M
B. “Immediate Actions” list
Repairs/improvements buyer must make immediately post-acquisition:
| Action | Estimated Cost | Deadline | Criticality |
|---|---|---|---|
| Replace 47 panels with hotspots | €12,000 | 1 month | High |
| Sensor recalibration | €3,000 | 2 weeks | Medium |
| Fence repair | €5,000 | 1 month | Low |
Total: €20,000 → Must be discounted from price or held in escrow until repair.
8. Critical red flags that can break the deal
1. Real production < 90% of P50
Possible causes:
- Intentional overestimation in development phase
- Serious construction defects
- Unfavorable grid conditions (chronic curtailment)
Action: Only proceed if you can identify and solve the cause. If not, abandon the operation.
2. Debt with very tight covenants
If existing debt has DSCR (Debt Service Coverage Ratio) covenants > 1.3 and plant is operating at the limit, any bad year can trigger default.
Action: Renegotiate debt with bank before closing or refinance it.
3. Non-transferable land contracts
If land lease has clauses preventing SPV sale without landowner consent (and they demand price renegotiation), you can get stuck.
Action: Confirm in writing that owner approves transaction.
4. Panels without IEC certification
Panels without IEC 61215 / IEC 61730 certificates can’t access manufacturer warranties or standard insurance.
Action: Discount 15-20% of panel value (warranty loss).
5. History of unresolved warranty claims
If there are pending claims to panel/inverter manufacturers and seller hasn’t followed up, you lose the right after purchase (warranties are usually non-transferable without notification).
Action: Demand they be resolved before closing or adjust price.
9. Technical due diligence costs
Typical breakdown (20-50 MW plant)
| Concept | Cost | Description |
|---|---|---|
| Independent engineer | €25,000 - 60,000 | Complete report |
| Legal advisor | €15,000 - 30,000 | Contract review |
| Financial advisor | €20,000 - 50,000 | Financial model and valuation |
| Technical testing | €5,000 - 15,000 | Thermography, I-V, megger |
| Insurance and contingencies | €5,000 - 10,000 | DD policy, travel |
| Total | €70,000 - 165,000 |
When is this cost justified?
- Transactions > €10M: Always
- Transactions €5-10M: Recommended (simplified DD)
- Transactions < €5M: Optional (can do internal DD if you have expertise)
DD ROI:
- Detecting a problem that adjusts price 5% in a €20M transaction = €1M saved
- DD cost: €100,000
- ROI: 10x
10. Conclusion: Due diligence is your insurance
Buying a photovoltaic plant without exhaustive technical due diligence is like buying a house without structural inspection: you can be lucky, or you can discover serious cracks when it’s too late.
The 5 commandments of technical DD:
- Don’t trust the seller: Verify everything with data from independent sources
- Hire experts: DD cost is insignificant vs risk of bad purchase
- Always visit the plant: Never close without stepping on the ground
- Analyze trends, not snapshots: 12 months of operational data is minimum
- Quantify everything: Translate each technical finding to economic impact (€)
Well-done due diligence not only protects your investment: it gives you negotiating power to adjust price and improve your return.
Need support in solar plant due diligence? 👉 Contact us to connect with specialized engineers
Want to access historical plant data for benchmarking? Explore our database of operational plants